2026 China Pet Industry White Paper (Consumer Report)
This year marks the 11th consecutive year of publication for the China Pet Industry White Paper. As 2026 begins, the 2026 China Pet Industry White Paper (Consumer Report) — produced by Pet Data and guided by the National Companion Animal (Pet) Standardization Technical Committee, the Pet Industry Branch of the China Animal Agriculture Association, and the Chinese Veterinary Medical Association — was officially released at the 2026 China Pet Industry Data Conference.Using more comprehensive and multi-dimensional data, the report reviews changes in China’s pet consumption market in 2025 and explores future development directions for the pet industry.
Below are key highlights from the 2026 China Pet Industry White Paper (Consumer Report):
Industry Overview: What Changed in the Overall Market in 2025?
1. 312.6 Billion Yuan Market: Is Cat Economy “Catching Up”?
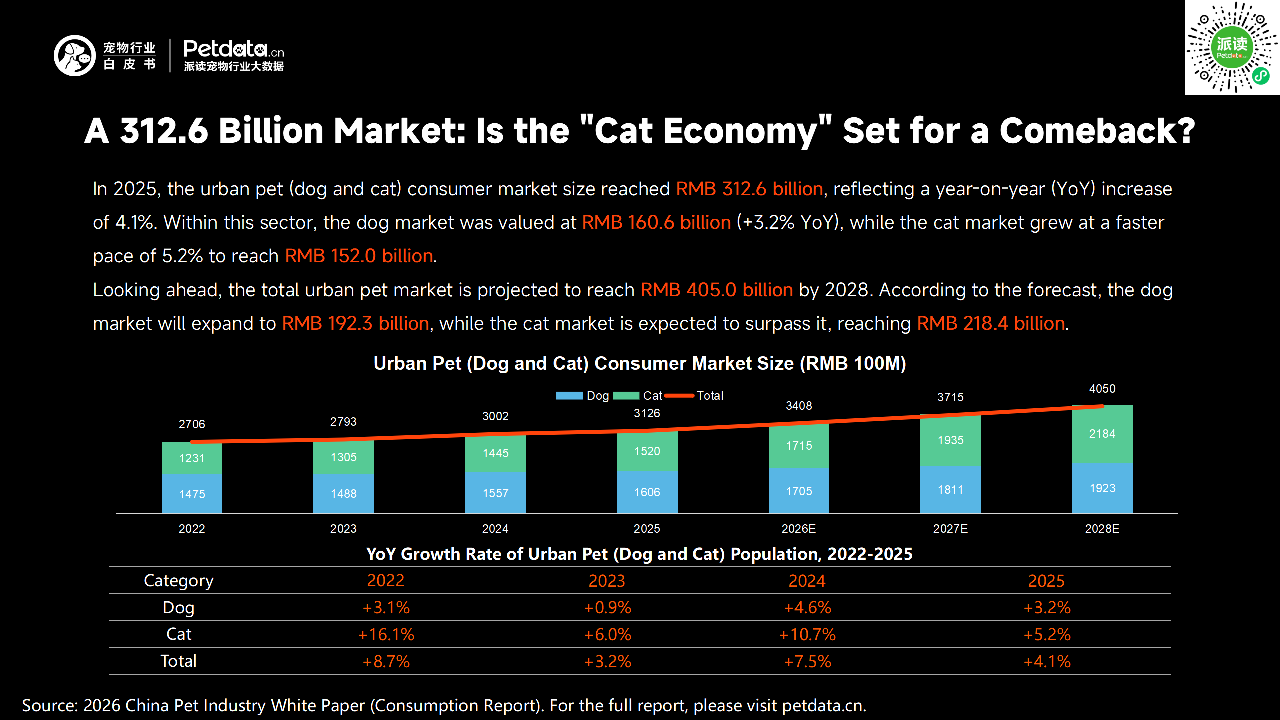
In 2025, the urban pet (dog and cat) consumption market reached 312.6 billion yuan, a year-on-year increase of 4.1%.
Dog consumption market: 160.6 billion yuan (+3.2%)
Cat consumption market: 152.0 billion yuan (+5.2%)
The urban pet (dog and cat) consumption market is projected to reach 405.0 billion yuan by 2028:
Dog market: 192.3 billion yuan
Cat market: 218.4 billion yuan
2. Population Growth Slows, but Consumption Accelerates
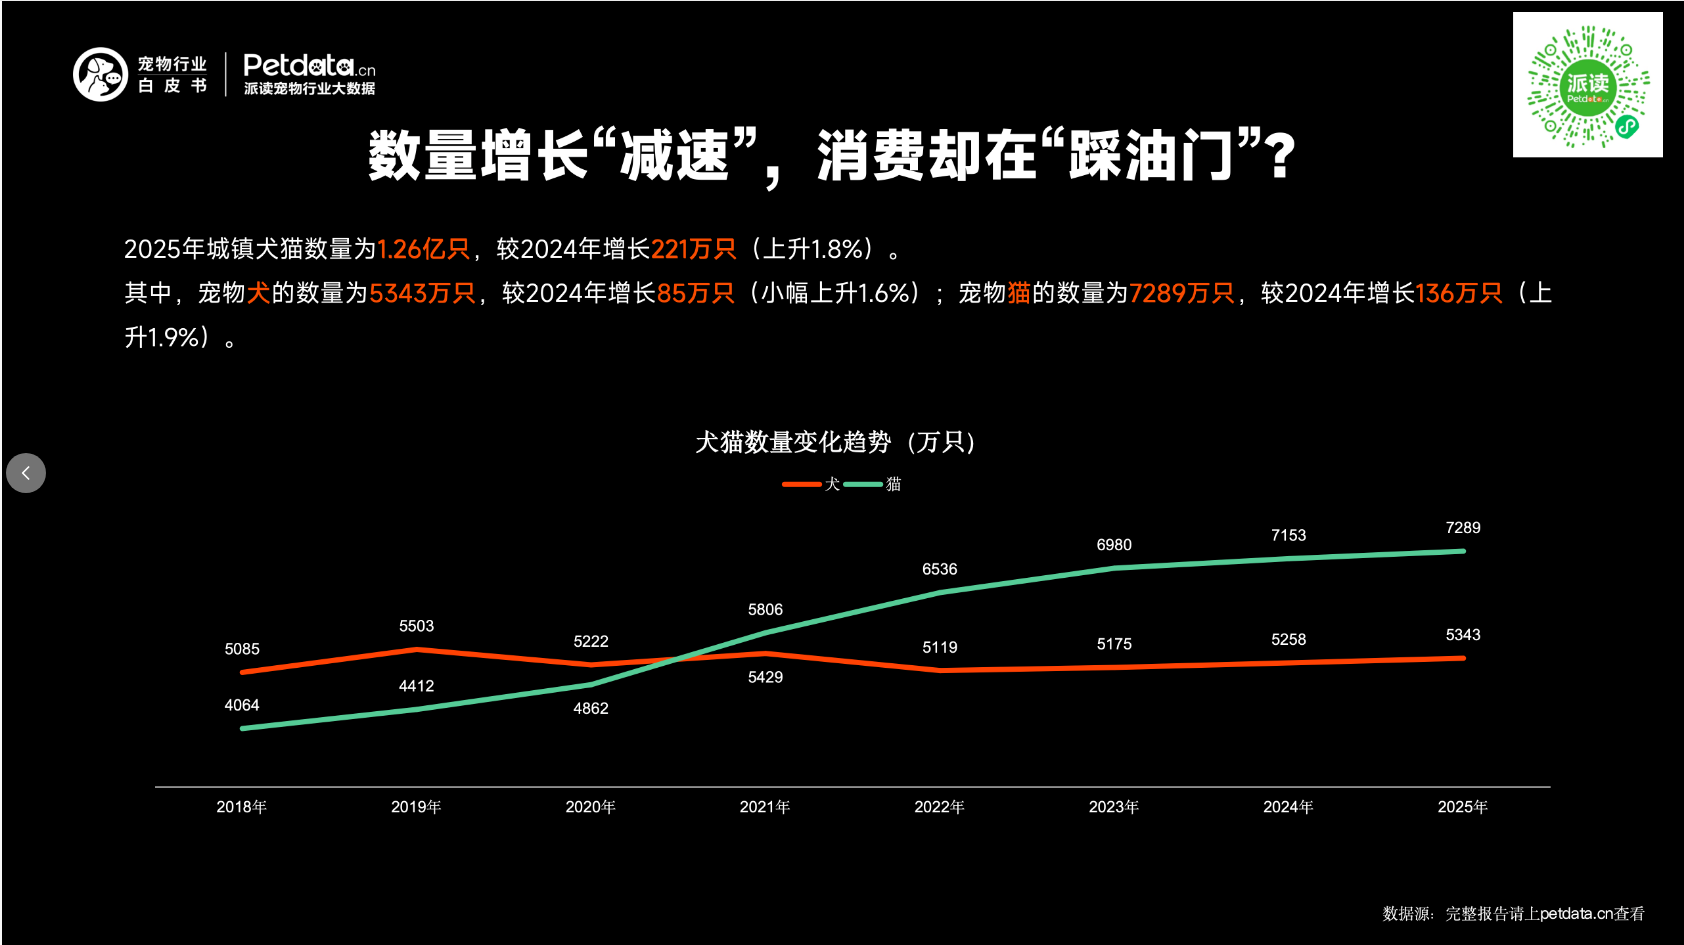
In 2025, the number of urban dogs and cats reached 126 million, an increase of 2.21 million (+1.8%) from 2024.
Pet dogs: 53.43 million (+850,000, +1.6%)
Pet cats: 72.89 million (+1.36 million, +1.9%)
3. Average Annual Spending per Pet Hits New Highs
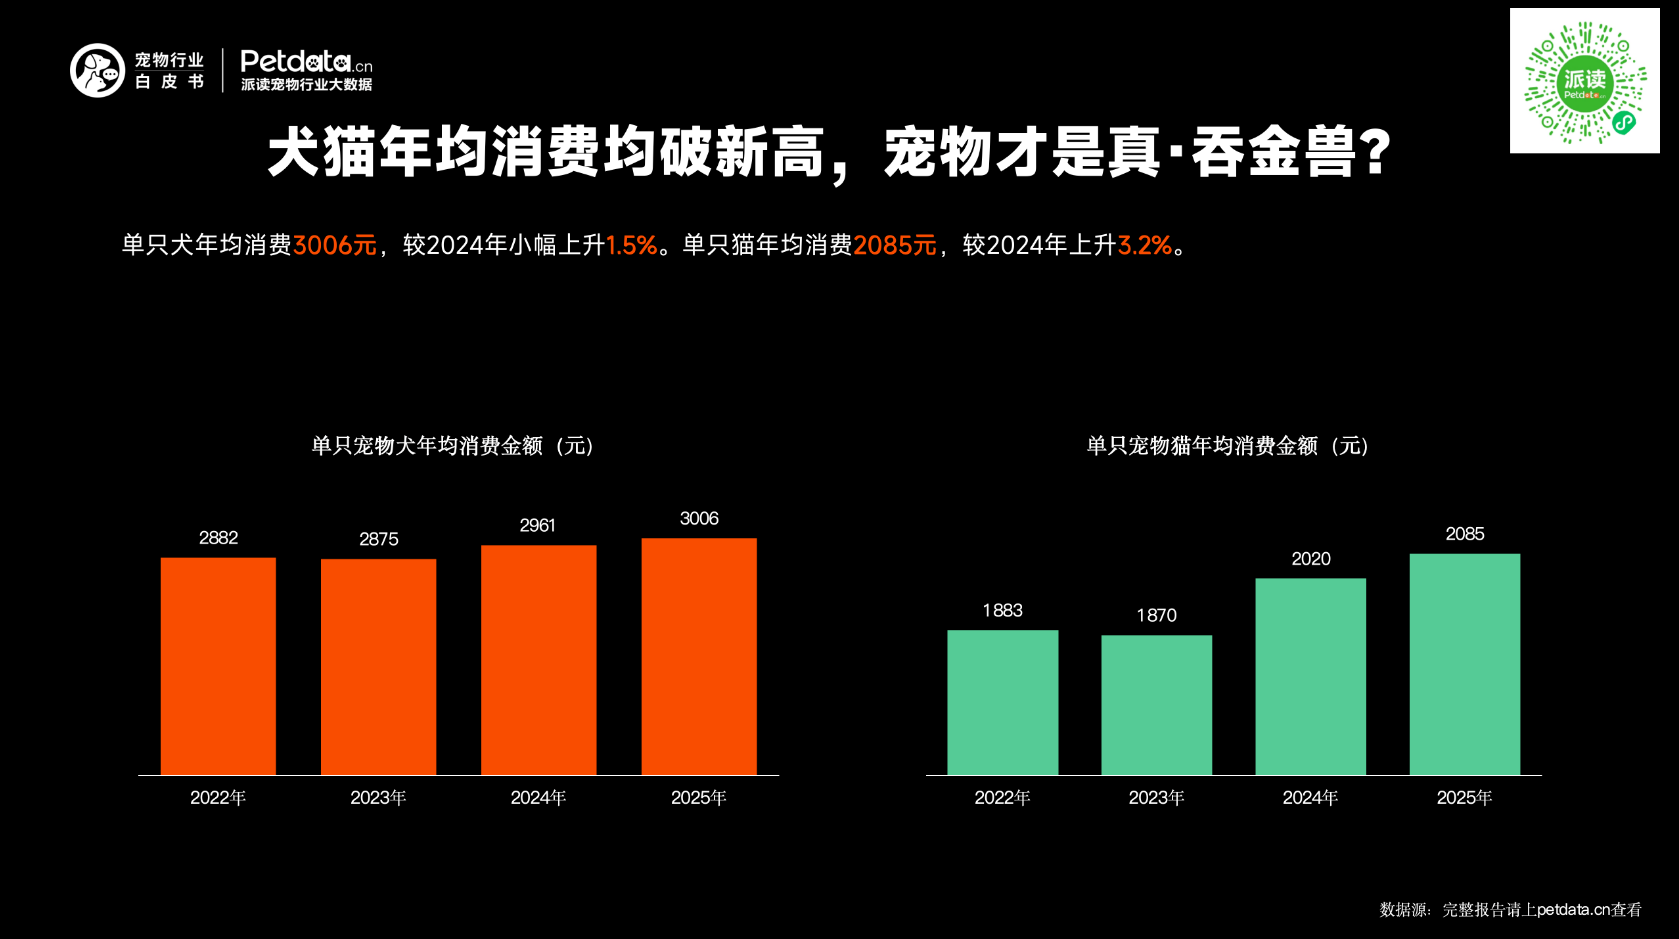
Average annual spending per dog: 3,006 yuan (+1.5%)
Average annual spending per cat: 2,085 yuan (+3.2%)
4. Food Remains Dominant; Medical Sector Slows
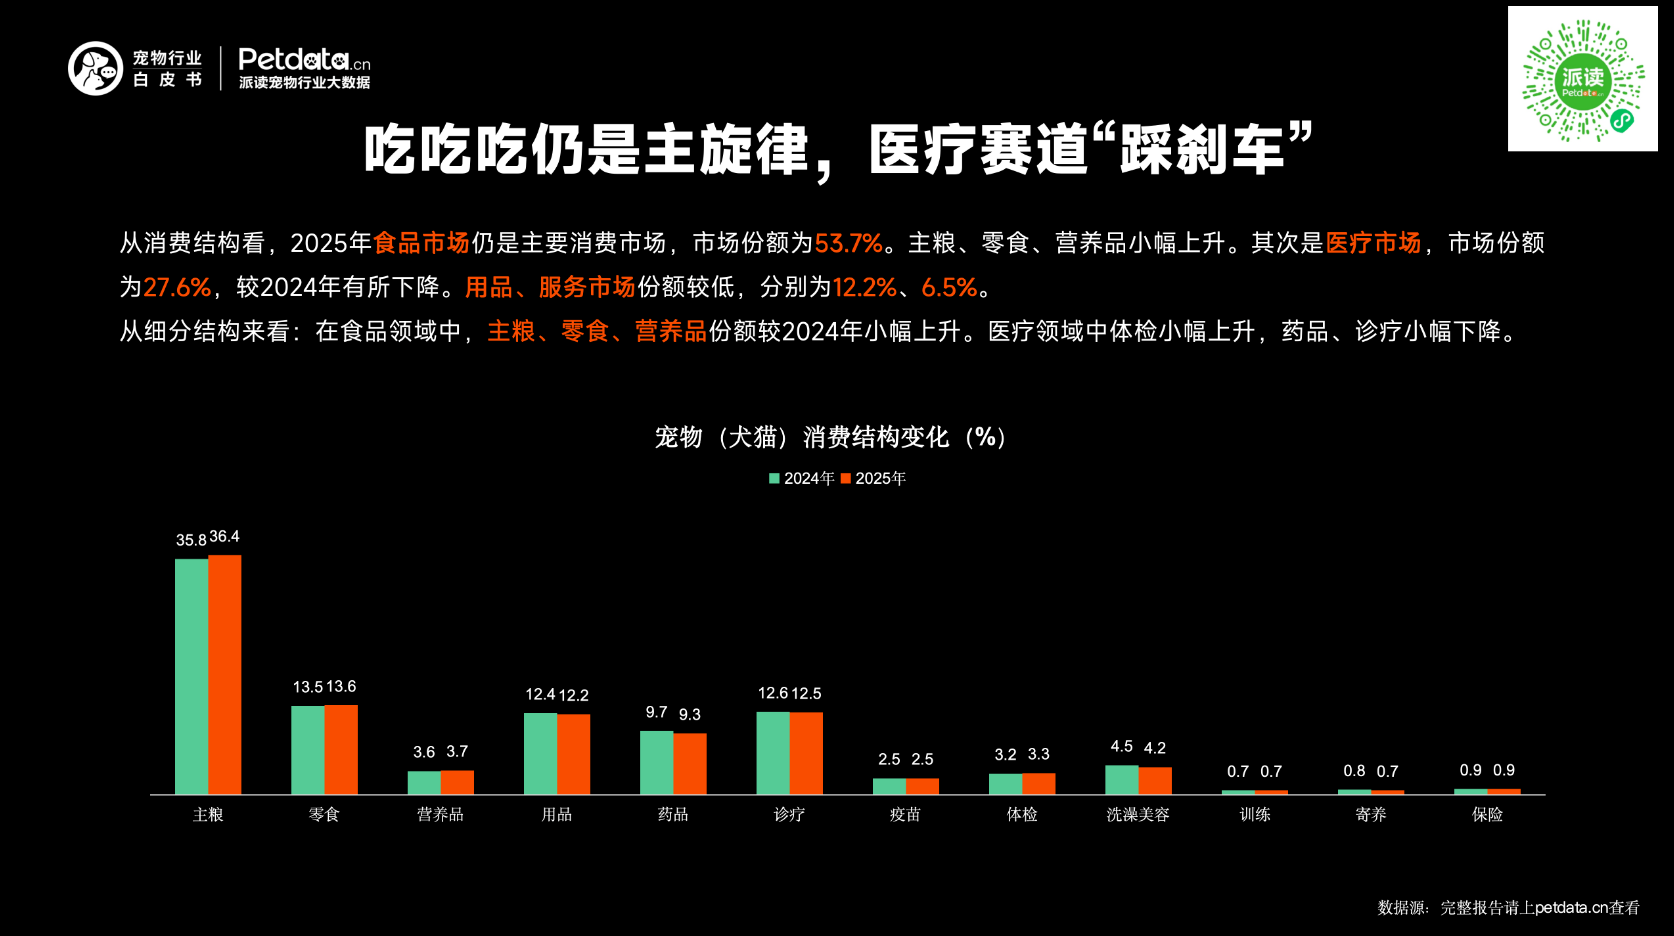
In 2025, pet food remained the largest consumption segment at 53.7% market share, with main food, treats, and supplements growing slightly.
Medical care: 27.6% (down from 2024)
Pet supplies: 12.2%
Pet services: 6.5%
Within food: staple food, treats, and supplements rose slightly.Within medical care: check-ups increased slightly; medicines and treatment slightly decreased.
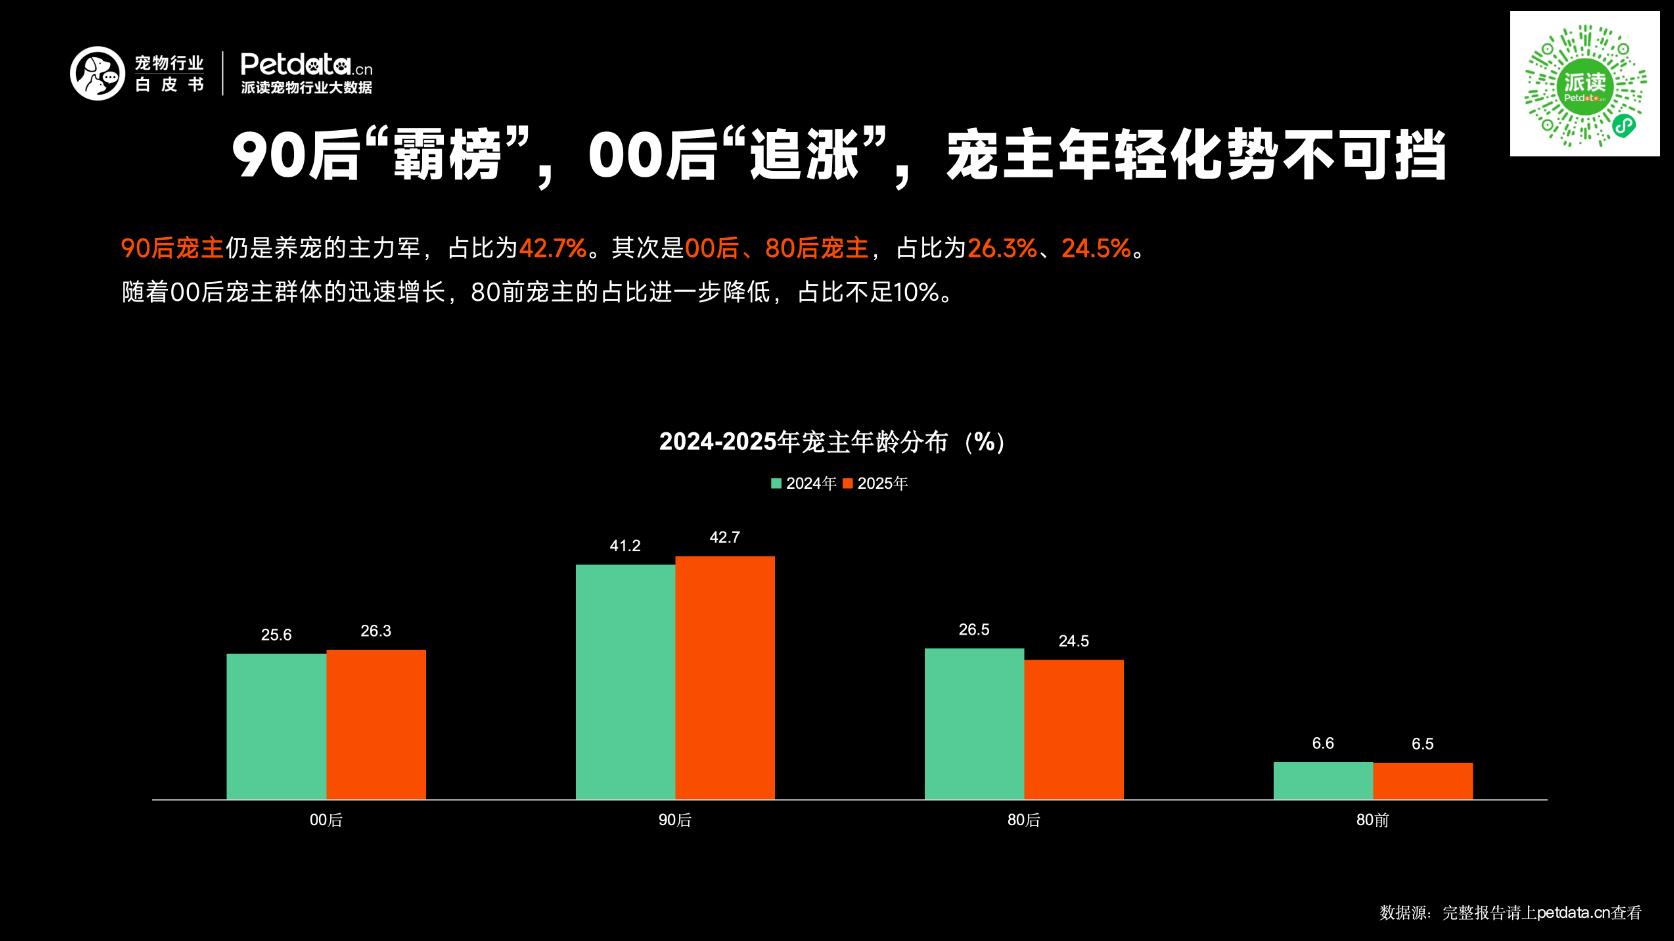
5. Post-90s Lead, Post-00s Surge: Pet Owners Growing Younger
Post-90s: 42.7% (mainstream group)
Post-00s: 26.3% (fast-growing)
Post-80s: 24.5%
Pre-80s: less than 10%
Pet Food: Fresh Food Rising, Functionality Upgrading
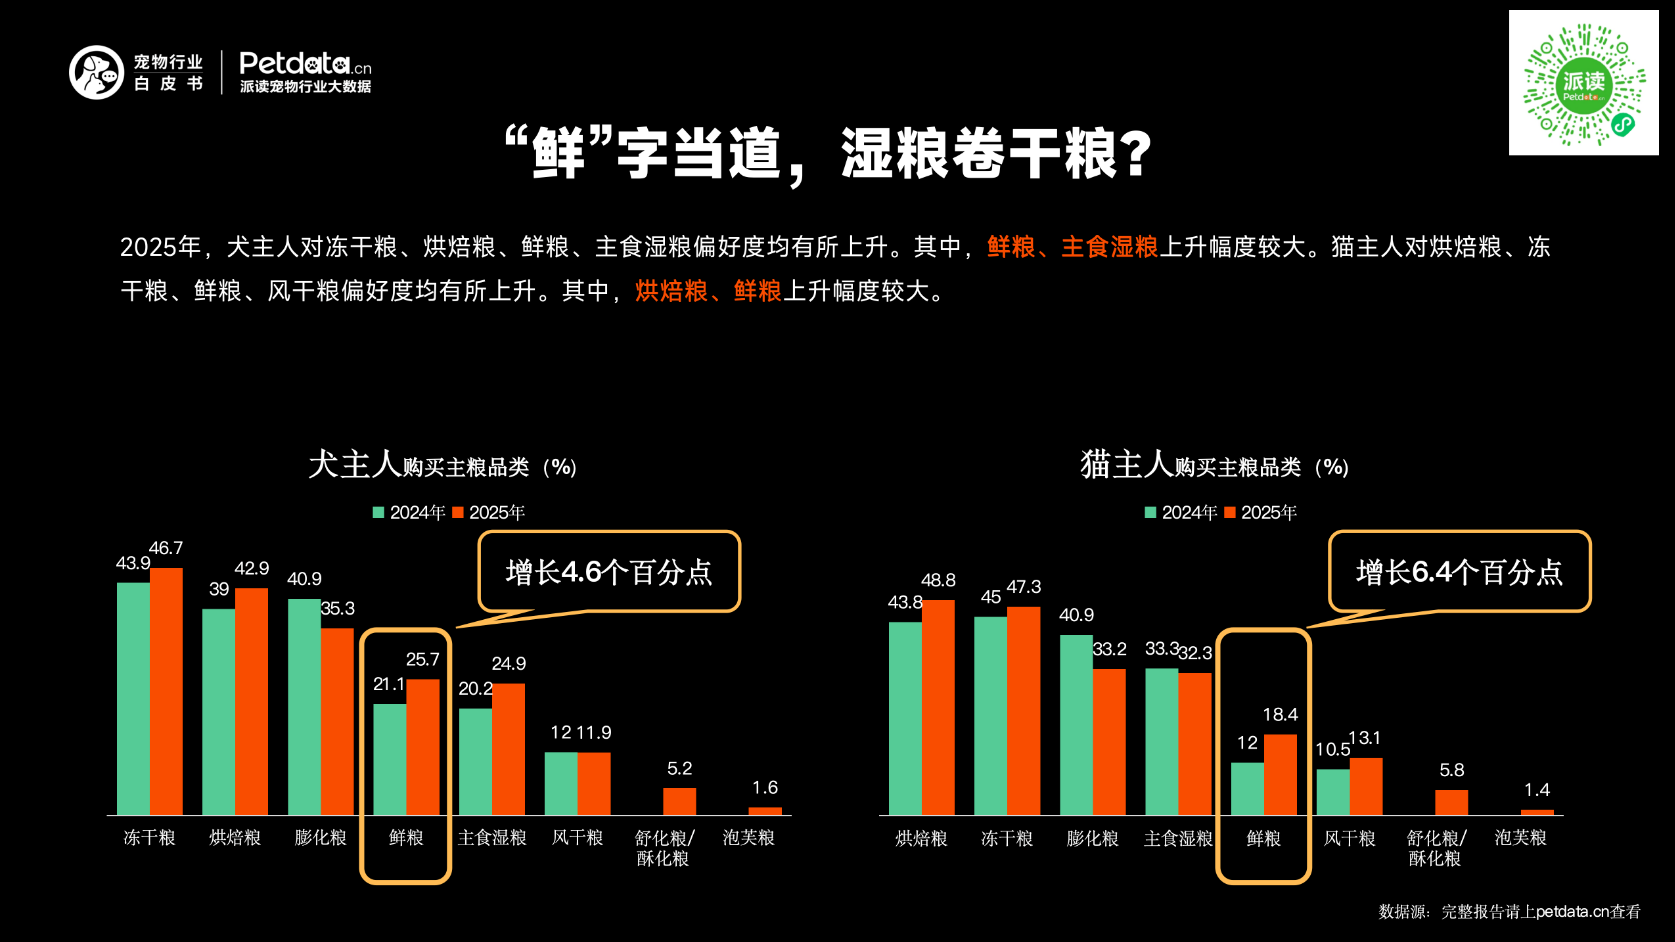
1. “Fresh” Leads the Trend: Wet Food Competing with Dry Food
In 2025, dog owners showed stronger preference for freeze-dried dry food, baked food, fresh food, and staple wet food — especially fresh food and staple wet food.Cat owners preferred baked food, freeze-dried food, fresh food, and air-dried food — with baked and fresh food rising most.
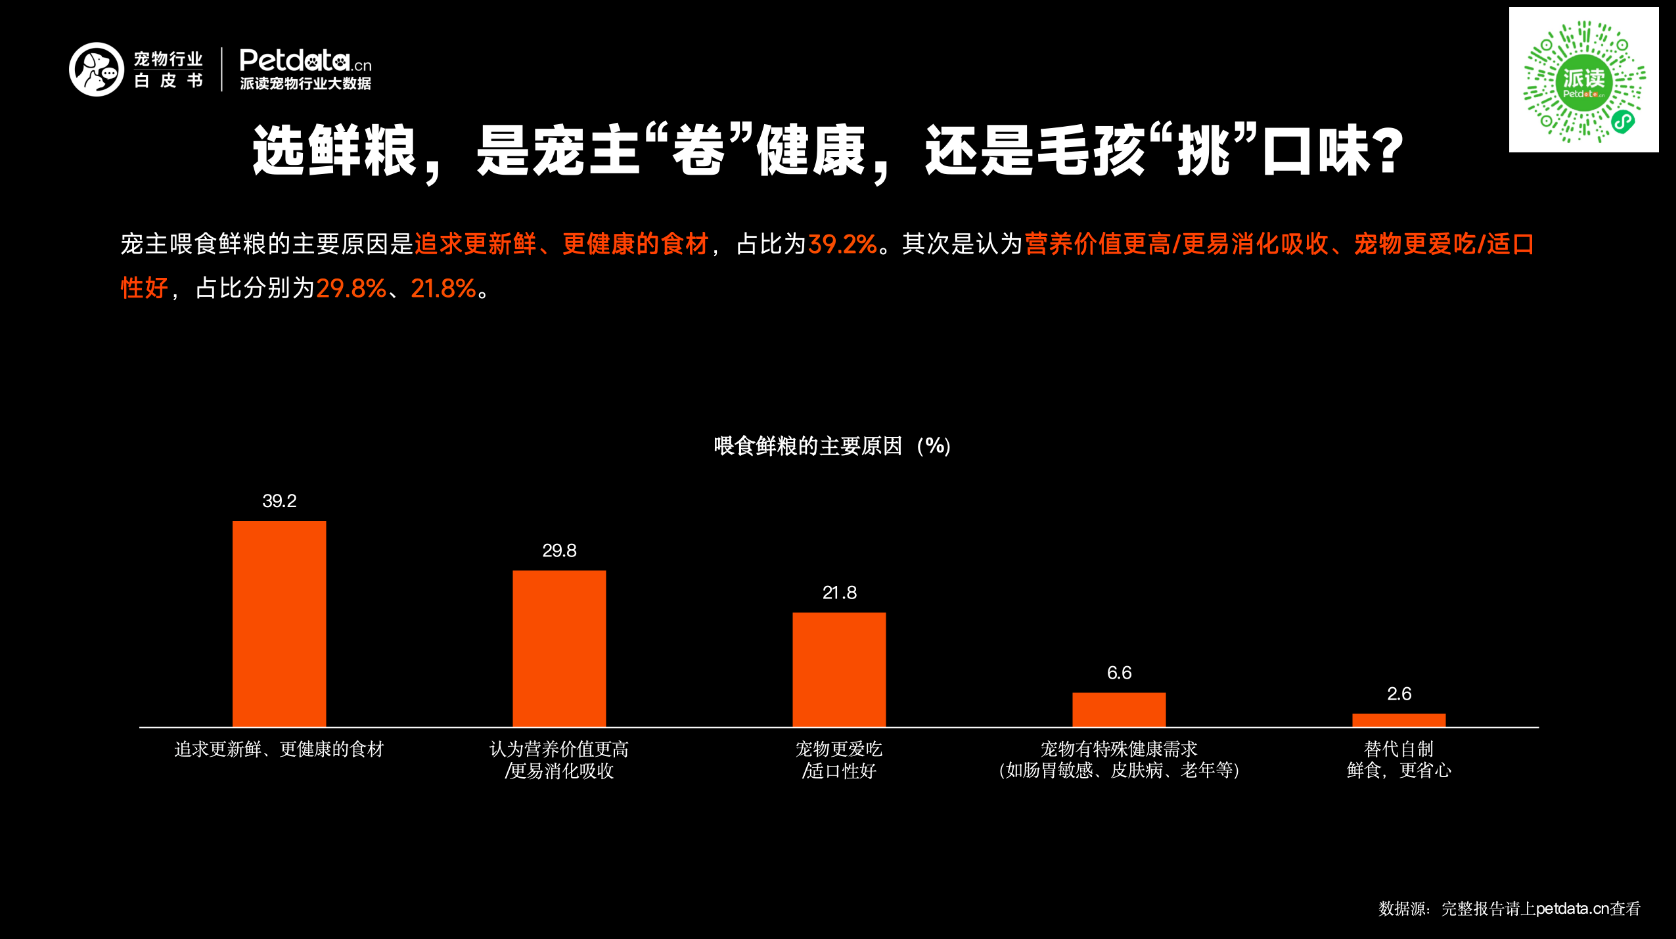
2. Why Fresh Food? Health & Palatability
39.2%: pursue fresher, healthier ingredients
29.8%: higher nutrition & better digestion
21.8%: pets prefer the taste
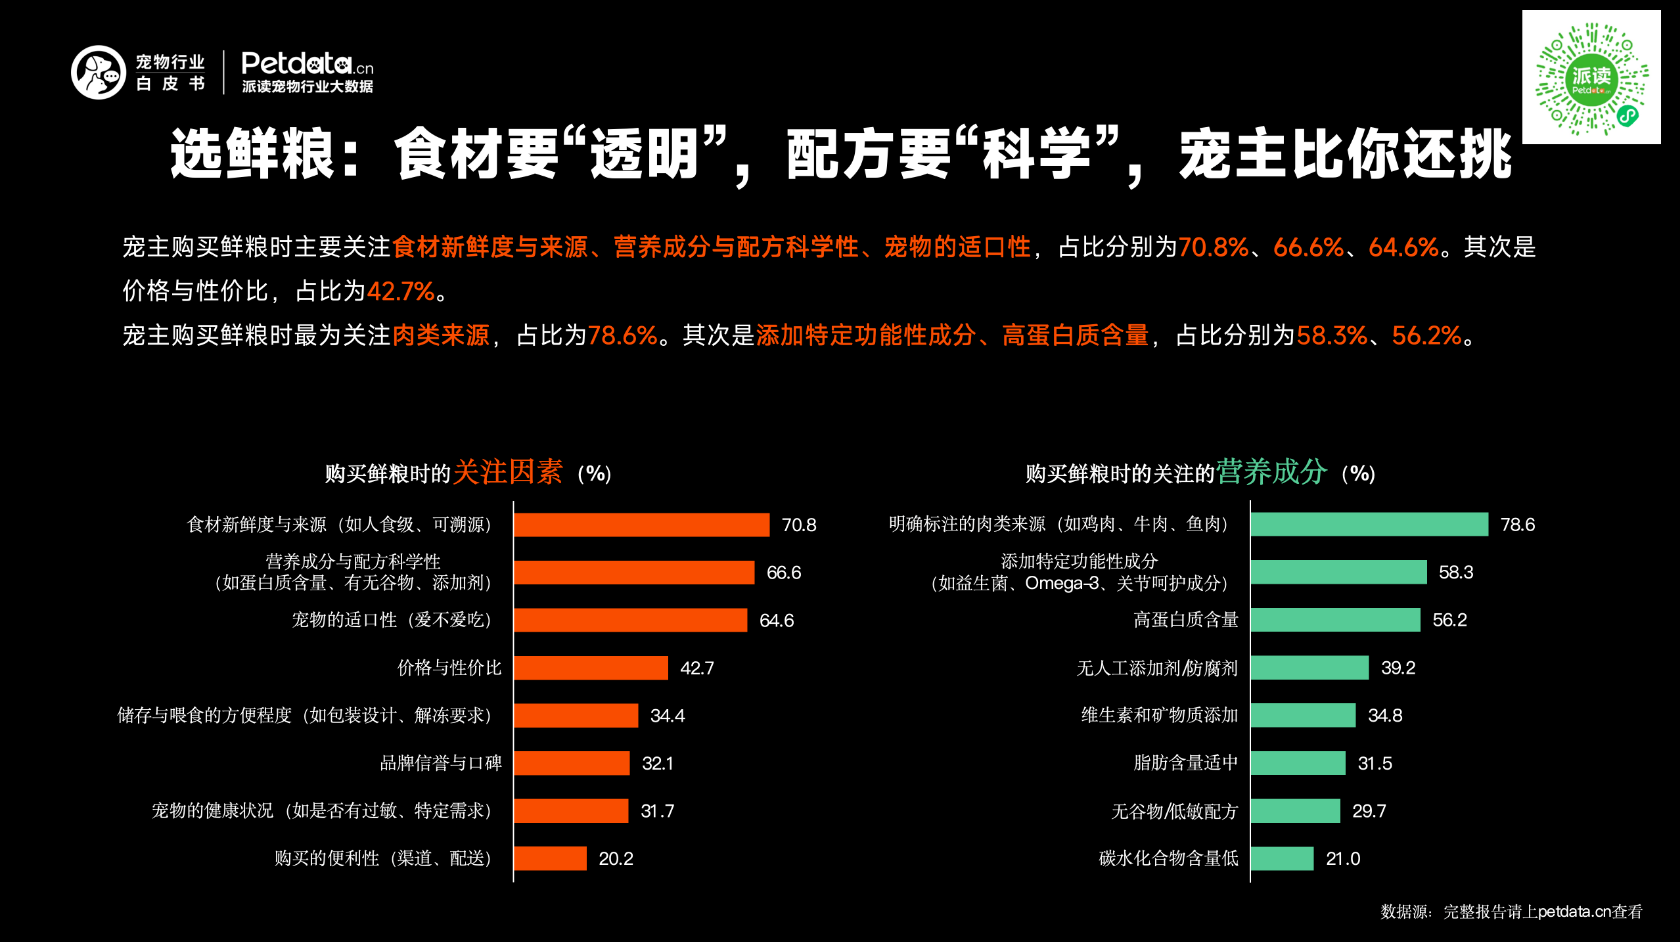
3. Top Buying Concerns for Fresh Food
70.8%: ingredient freshness & source
66.6%: nutrition & formula science
64.6%: palatability
42.7%: price & value
When choosing fresh food:
78.6% care most about meat source
58.3% functional additives
56.2% high protein
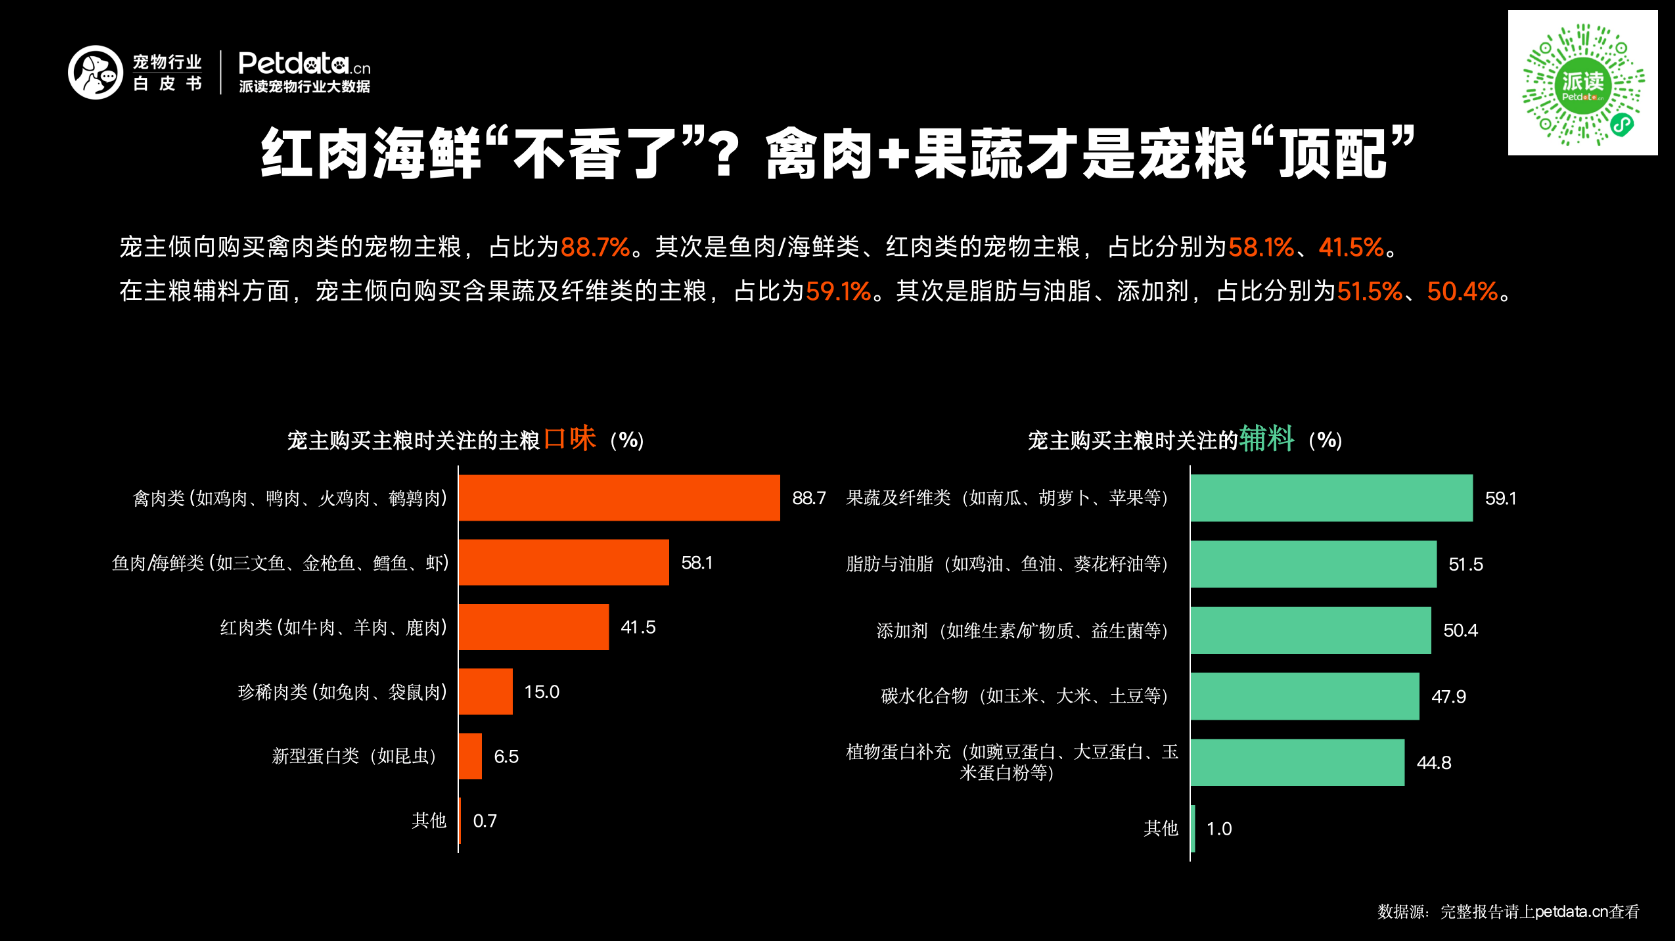
4. Poultry + Fruits & Vegetables Become Top Combo
88.7% prefer poultry-based staple food
58.1% fish/seafood
41.5% red meat
For additives:
59.1% fruits & vegetables
51.5% fats & oils
50.4% additives
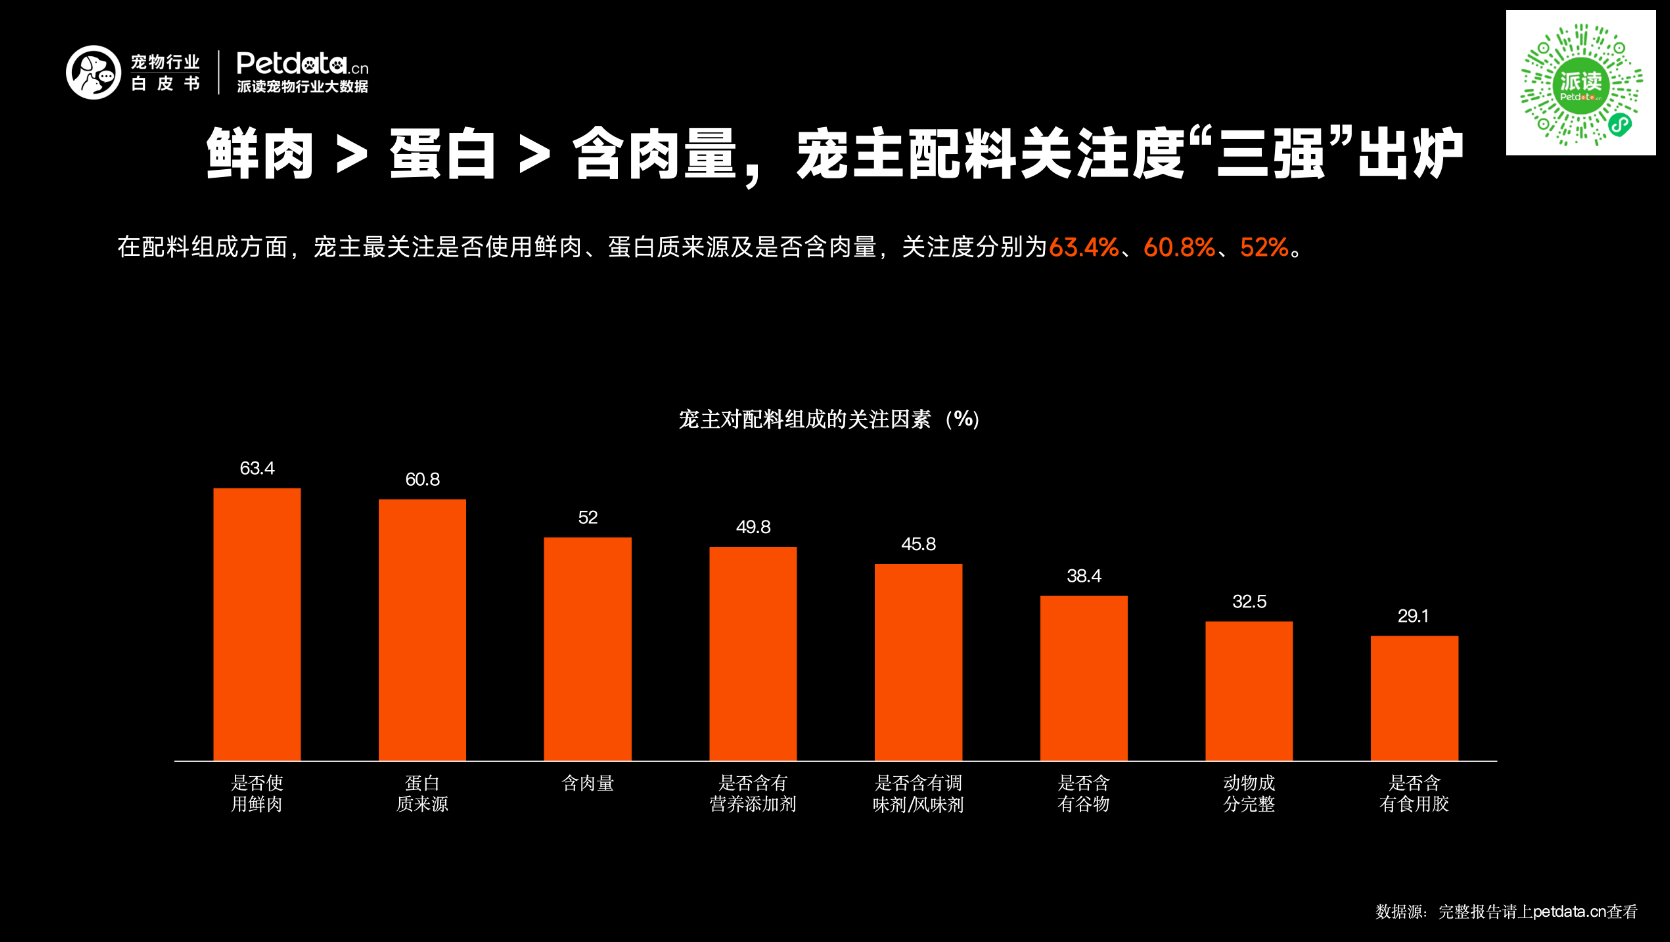
5. Top 3 Ingredient Focuses
Fresh meat (63.4%)
Protein source (60.8%)
Meat content (52.0%)
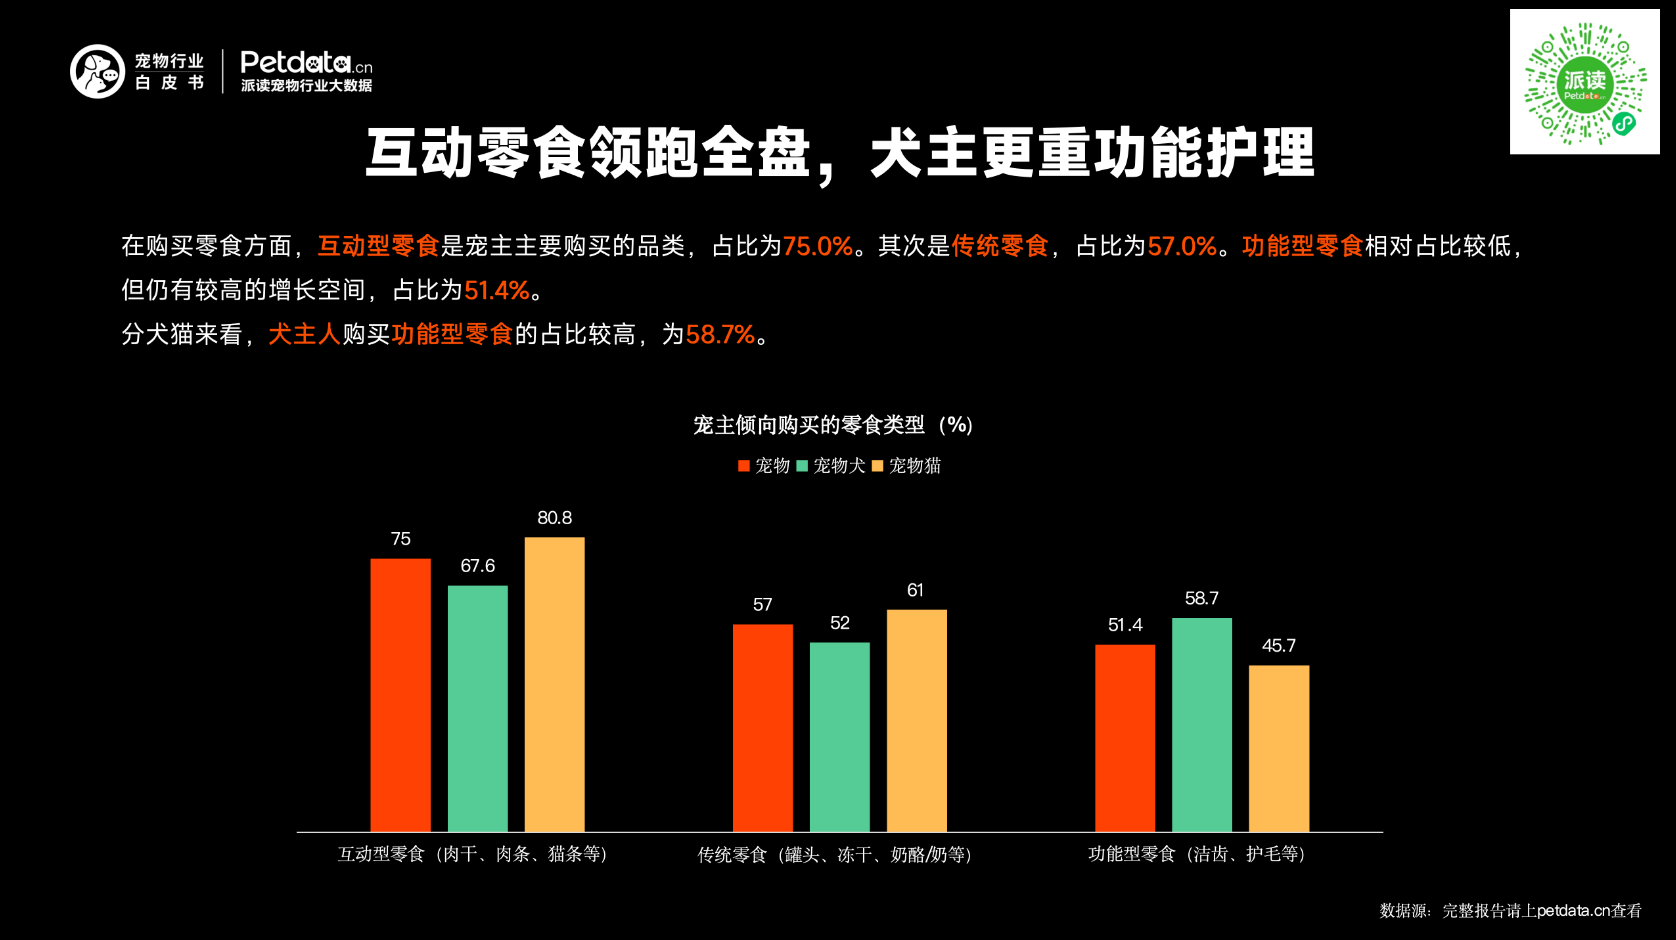
6. Interactive Treats Lead; Dog Owners Prefer Functional Treats
75.0% buy interactive treats
57.0% traditional treats
51.4% functional treats
Dog owners: 58.7% buy functional treats.
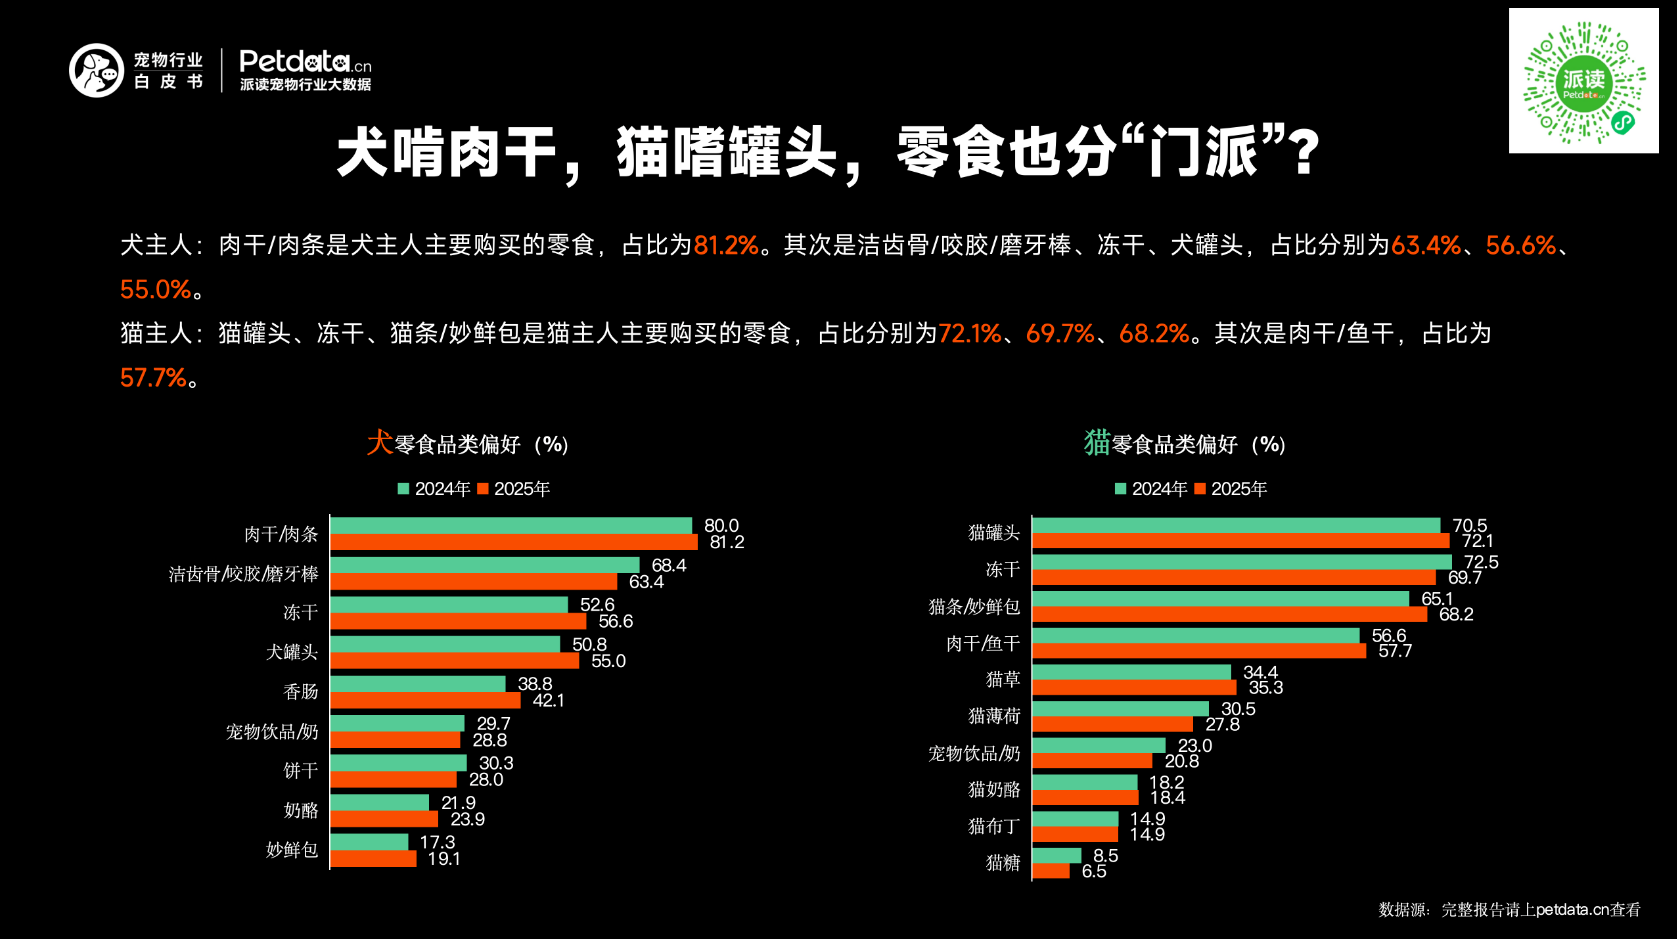
7. Treat Preferences: Dogs Love Jerky; Cats Love Canned Food
Dog owners:
81.2% jerky/meat strips
63.4% dental chews
56.6% freeze-dried
55.0% canned dog food
Cat owners:
72.1% canned cats
69.7% freeze-dried
68.2% cat strips / creamy treats
57.7% dried meat/fish
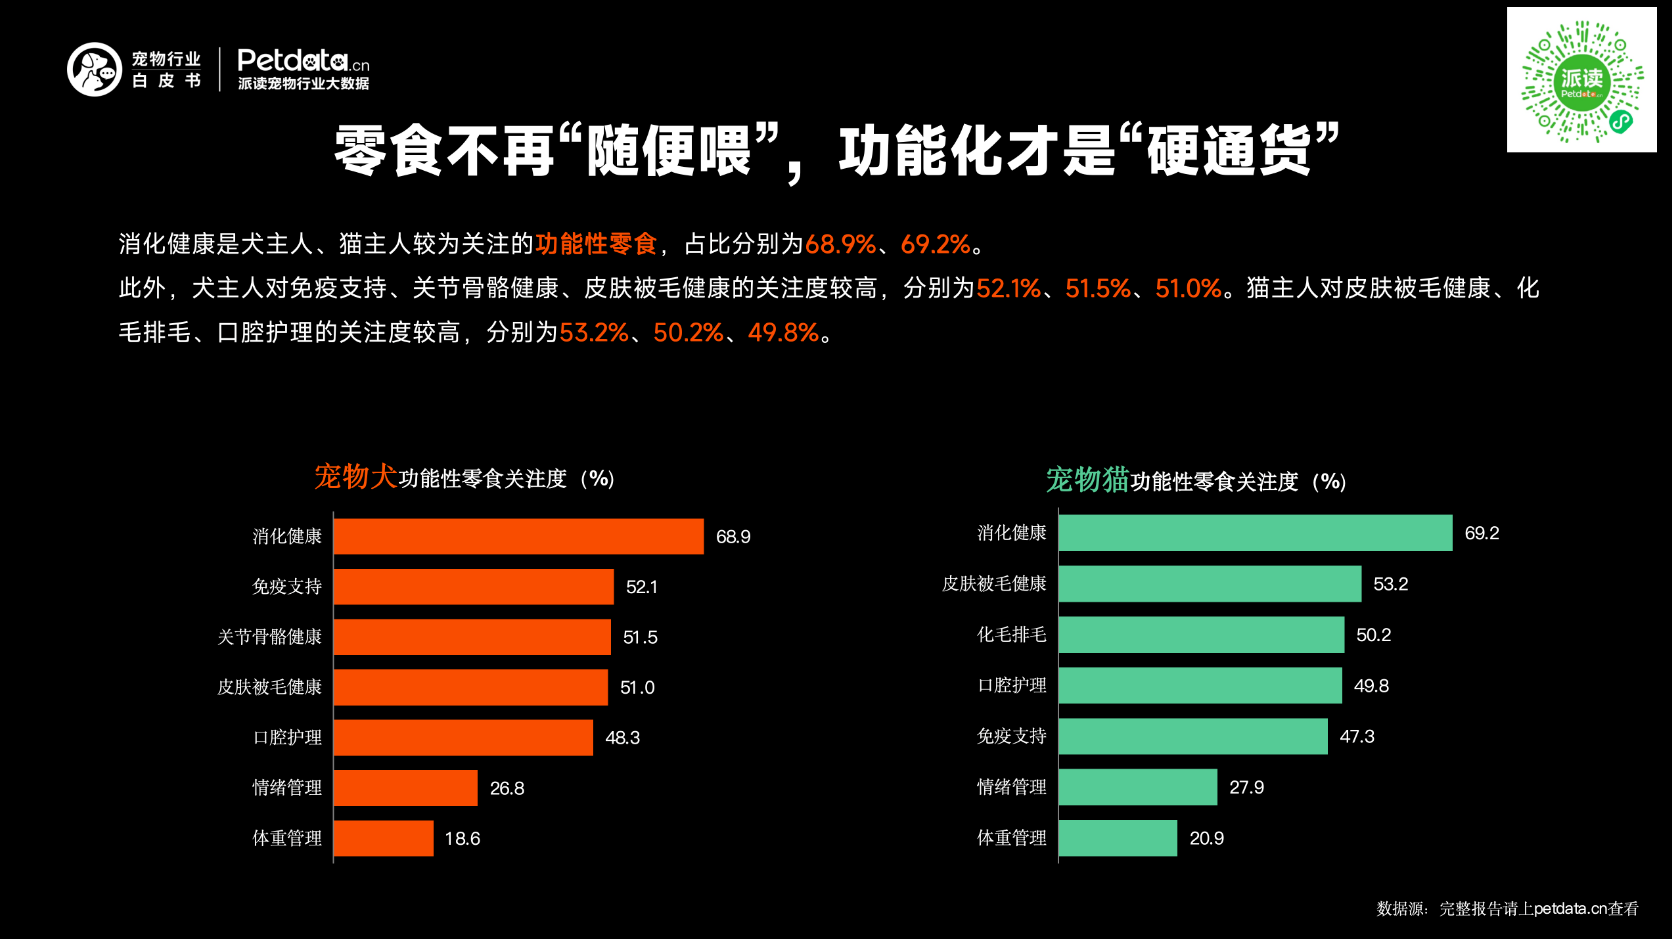
8. Functional Treats Become Mainstream
Digestive health is the top concern for both dog and cat owners:
68.9% (dogs)
69.2% (cats)
For dogs: immune support, joint & bone health, skin & coat health.For cats: skin & coat, hairball control, oral care.
Pet Supplies: Segmentation Deepens, Consumption Upgrades
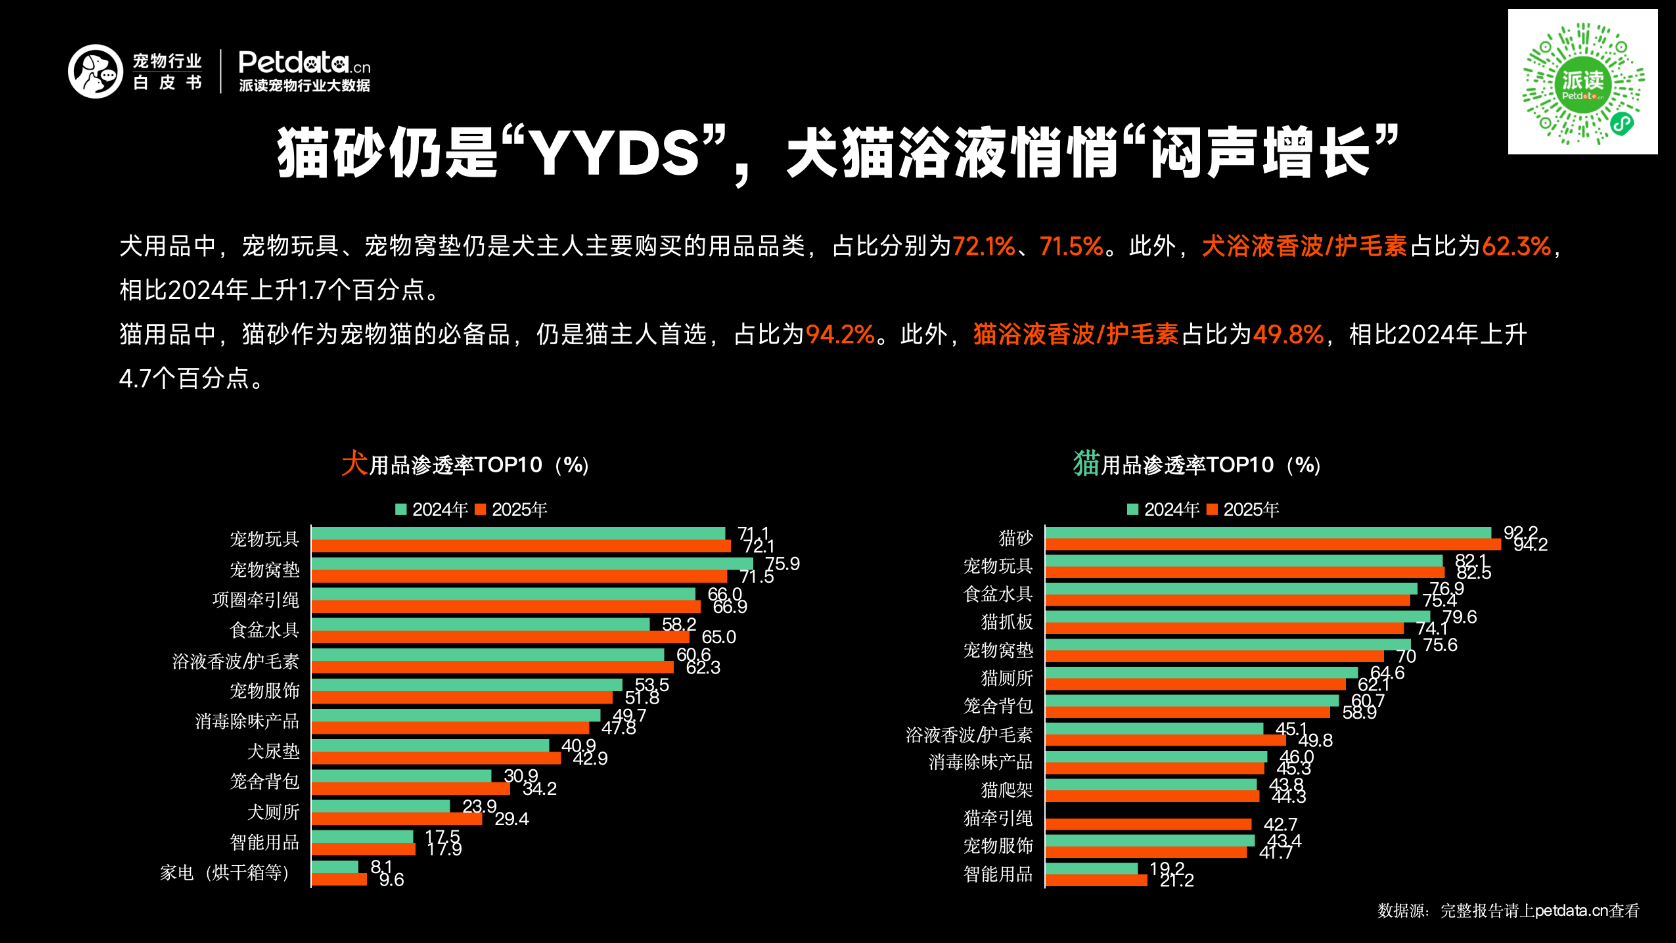
1. Cat Litter Dominates; Shampoos Grow Steadily
Dog supplies:
72.1% toys
71.5% beds & mats
62.3% shampoo & conditioner (+1.7 pts)
Cat supplies:
94.2% cat litter (essential)
49.8% shampoo & conditioner (+4.7 pts)
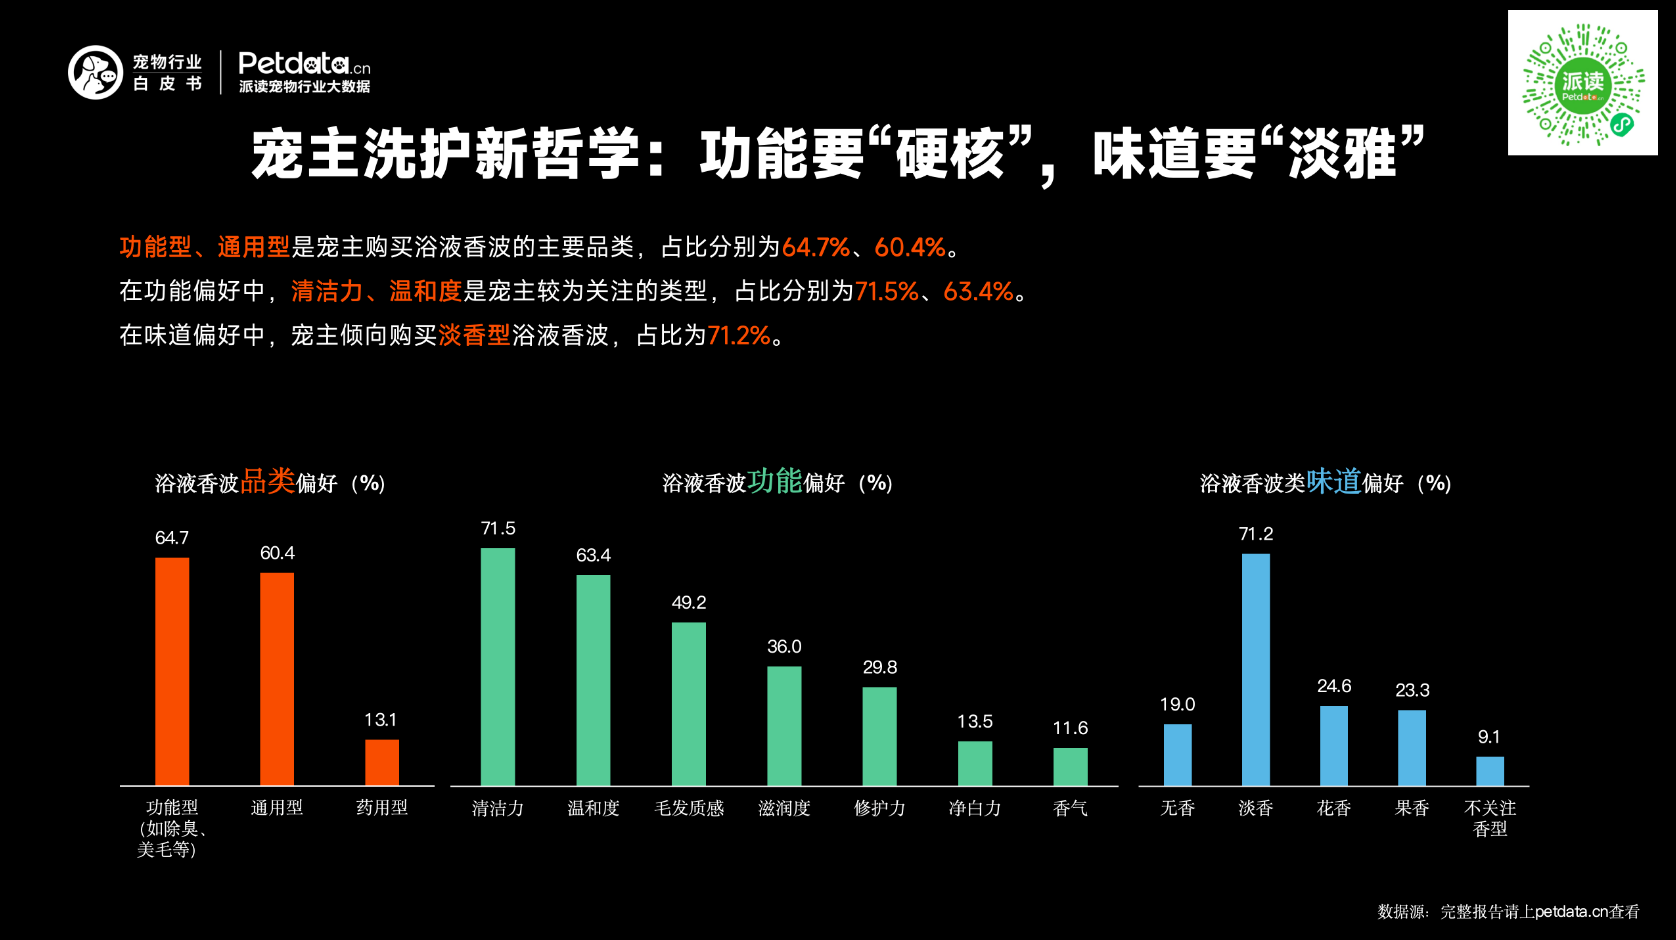
2. Grooming Philosophy: Strong Function + Light Fragrance
64.7% functional shampoo
60.4% general shampoo
Top concerns:
71.5% cleaning power
63.4% mildness
71.2% light fragrance
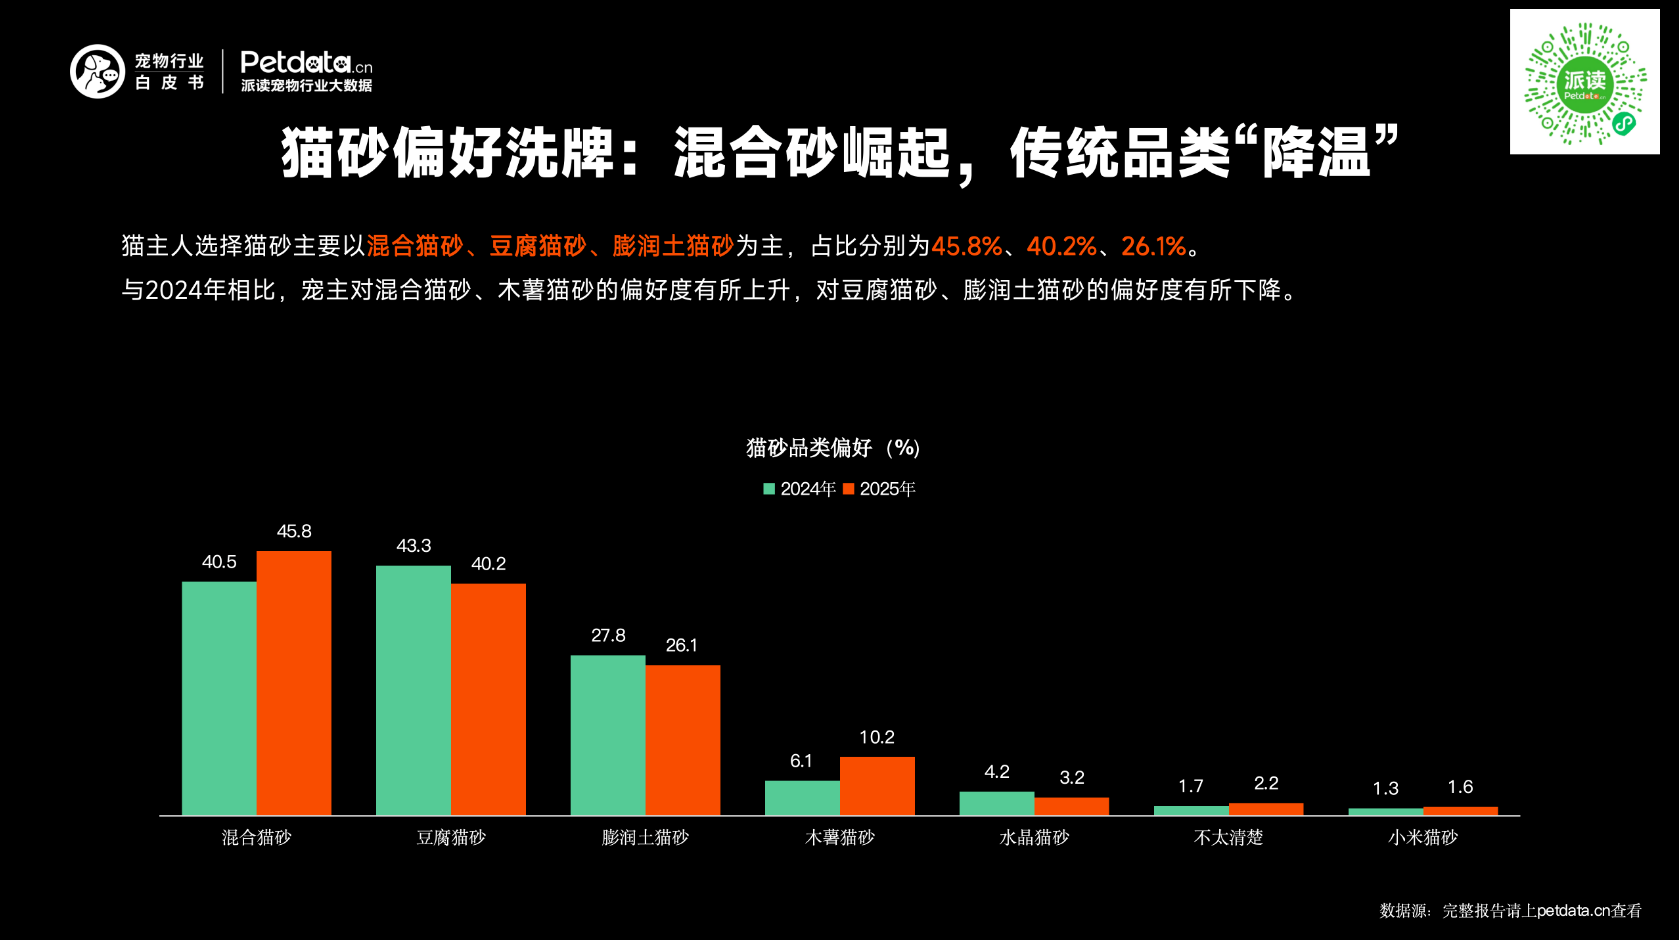
3. Cat Litter Preference Shift: Mixed Litter Rises
Mixed litter: 45.8%
Tofu litter: 40.2%
Bentonite: 26.1%
Mixed and cassava litter grew in popularity; tofu and bentonite declined.
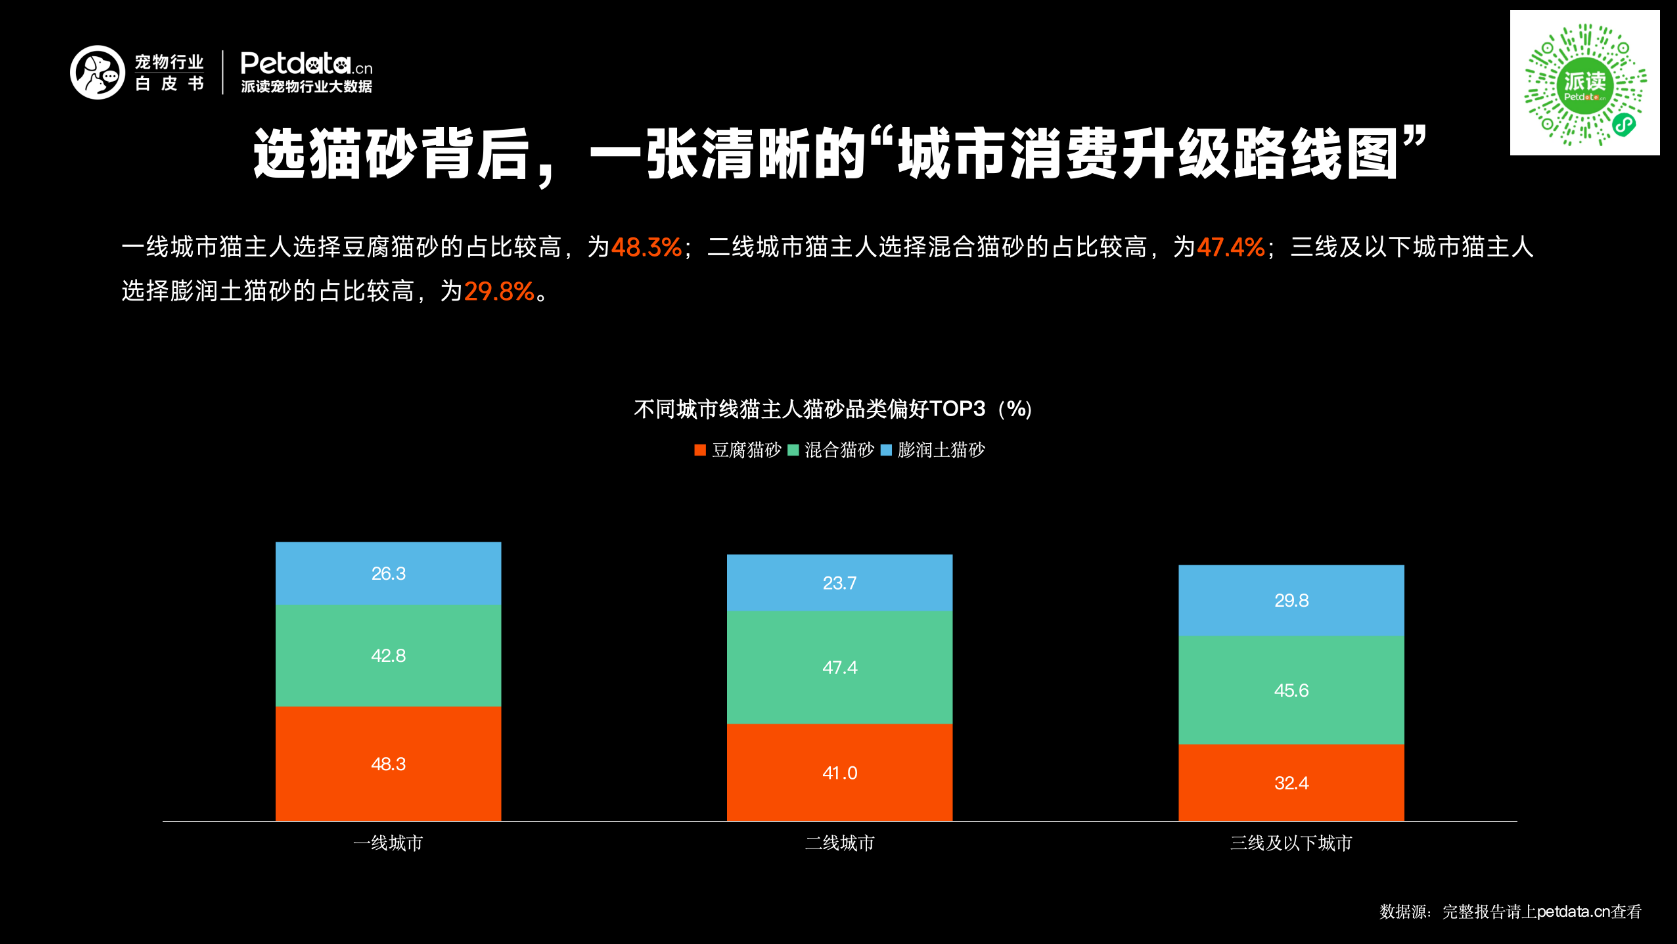
4. City Tier Consumption Upgrade Pattern
Tier-1: more tofu litter (48.3%)
Tier-2: more mixed litter (47.4%)
Tier-3 & below: more bentonite (29.8%)
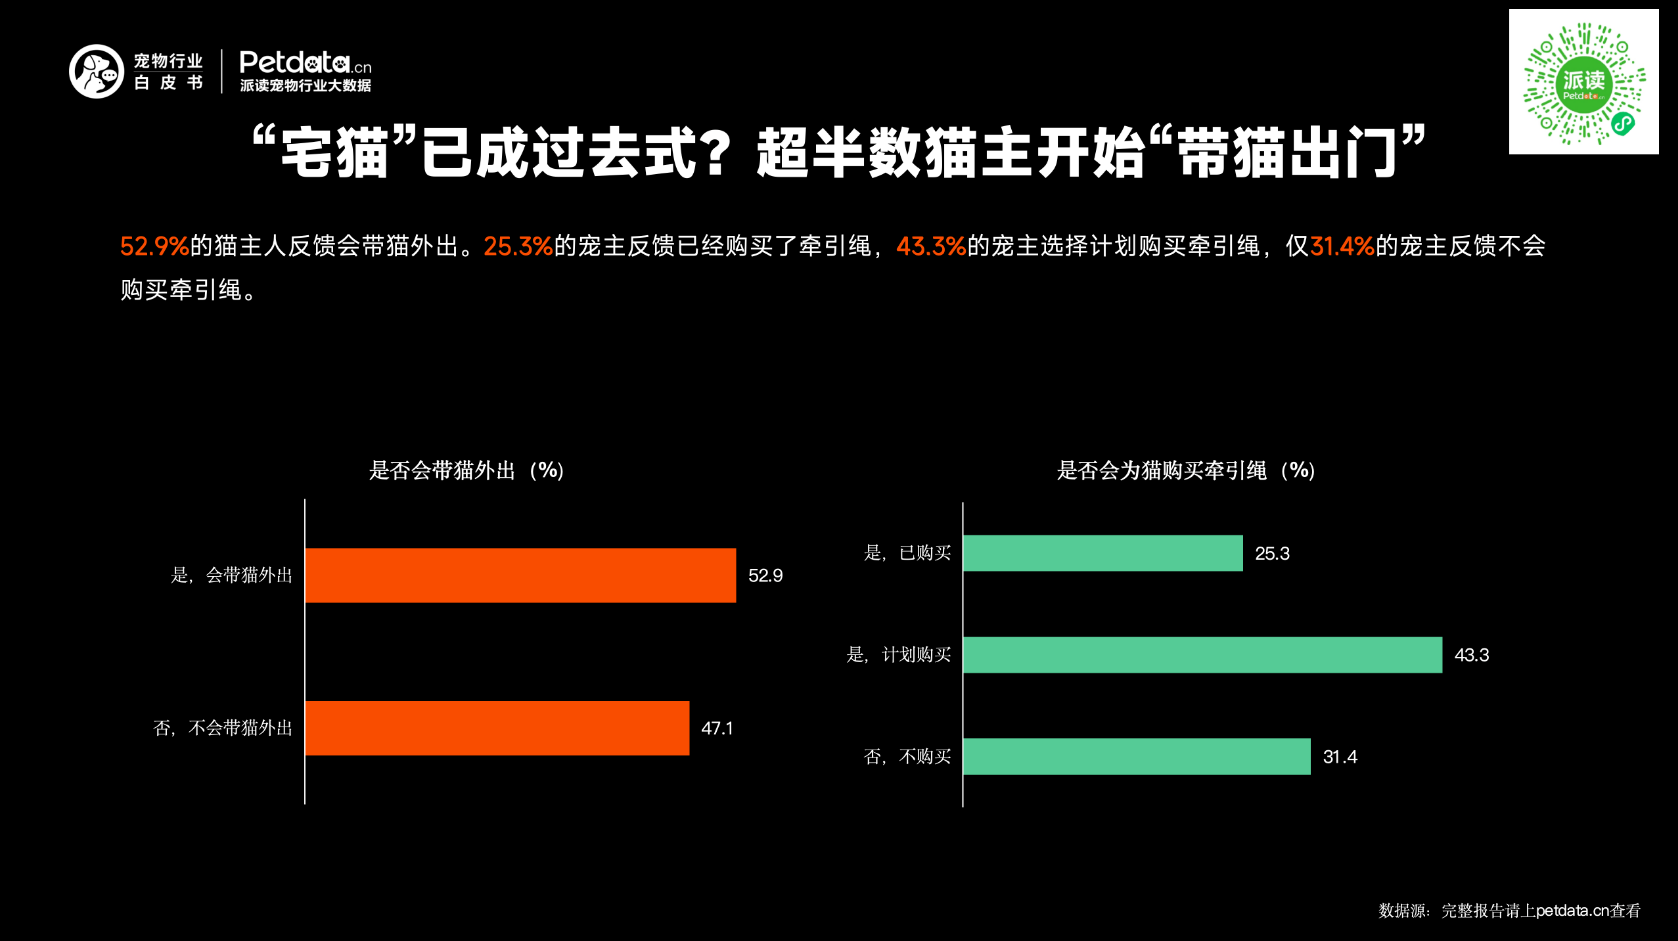
5. Over Half of Cat Owners Take Cats Out
52.9% of cat owners take their cats outdoors.
25.3% already bought leashes
43.3% plan to buy
31.4% will not buy
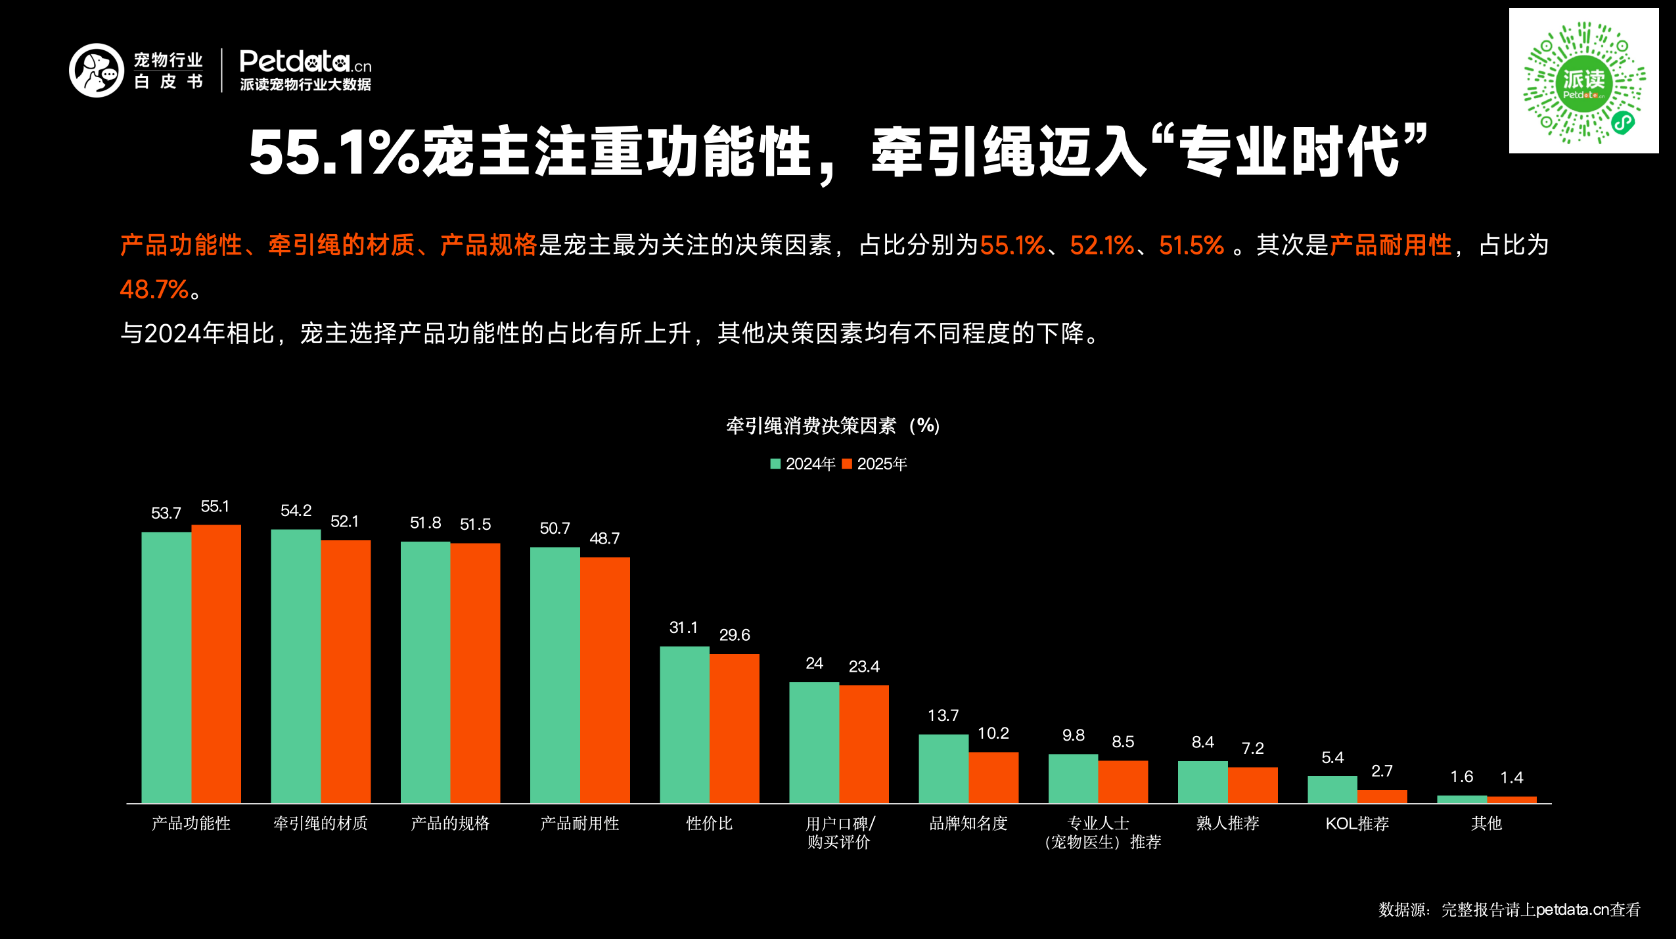
6. Leashes Enter “Professional Era”
Top buying factors:
55.1% functionality
52.1% material
51.5% size
48.7% durability
Pet Healthcare: Treatment Active, Prevention Under Pressure
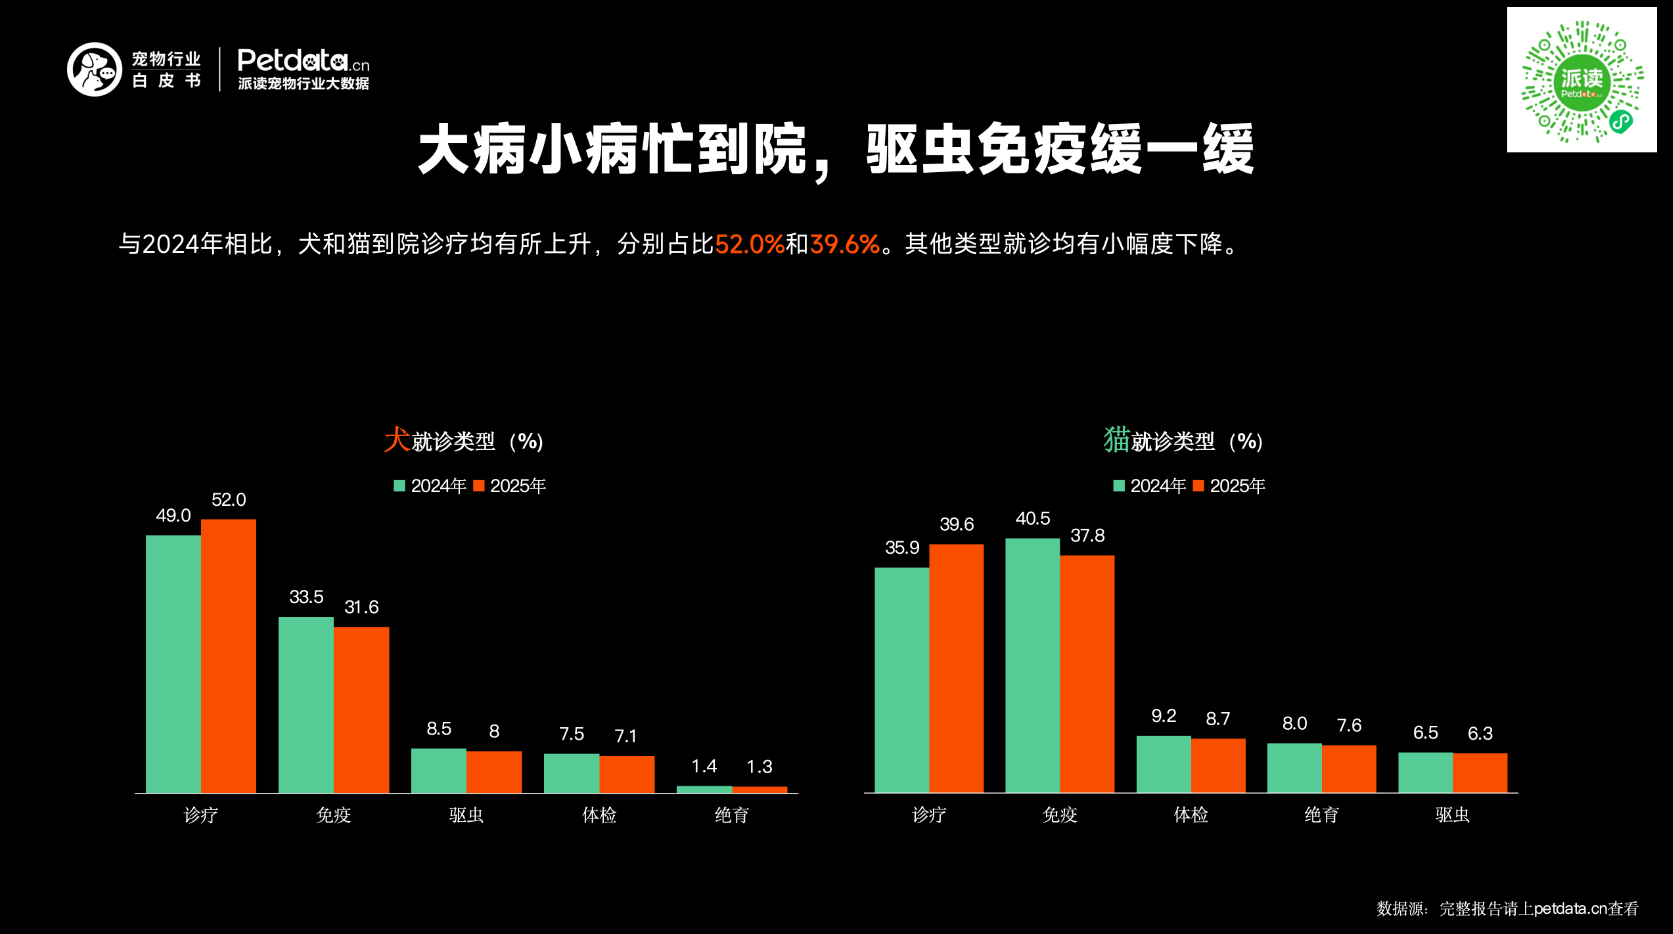
1. More Hospital Visits for Illnesses: Deworming and Vaccination Delayed
Compared with 2024, hospital visits for dogs and cats both increased, reaching 52.0% and 39.6% respectively. Other types of veterinary visits declined slightly.
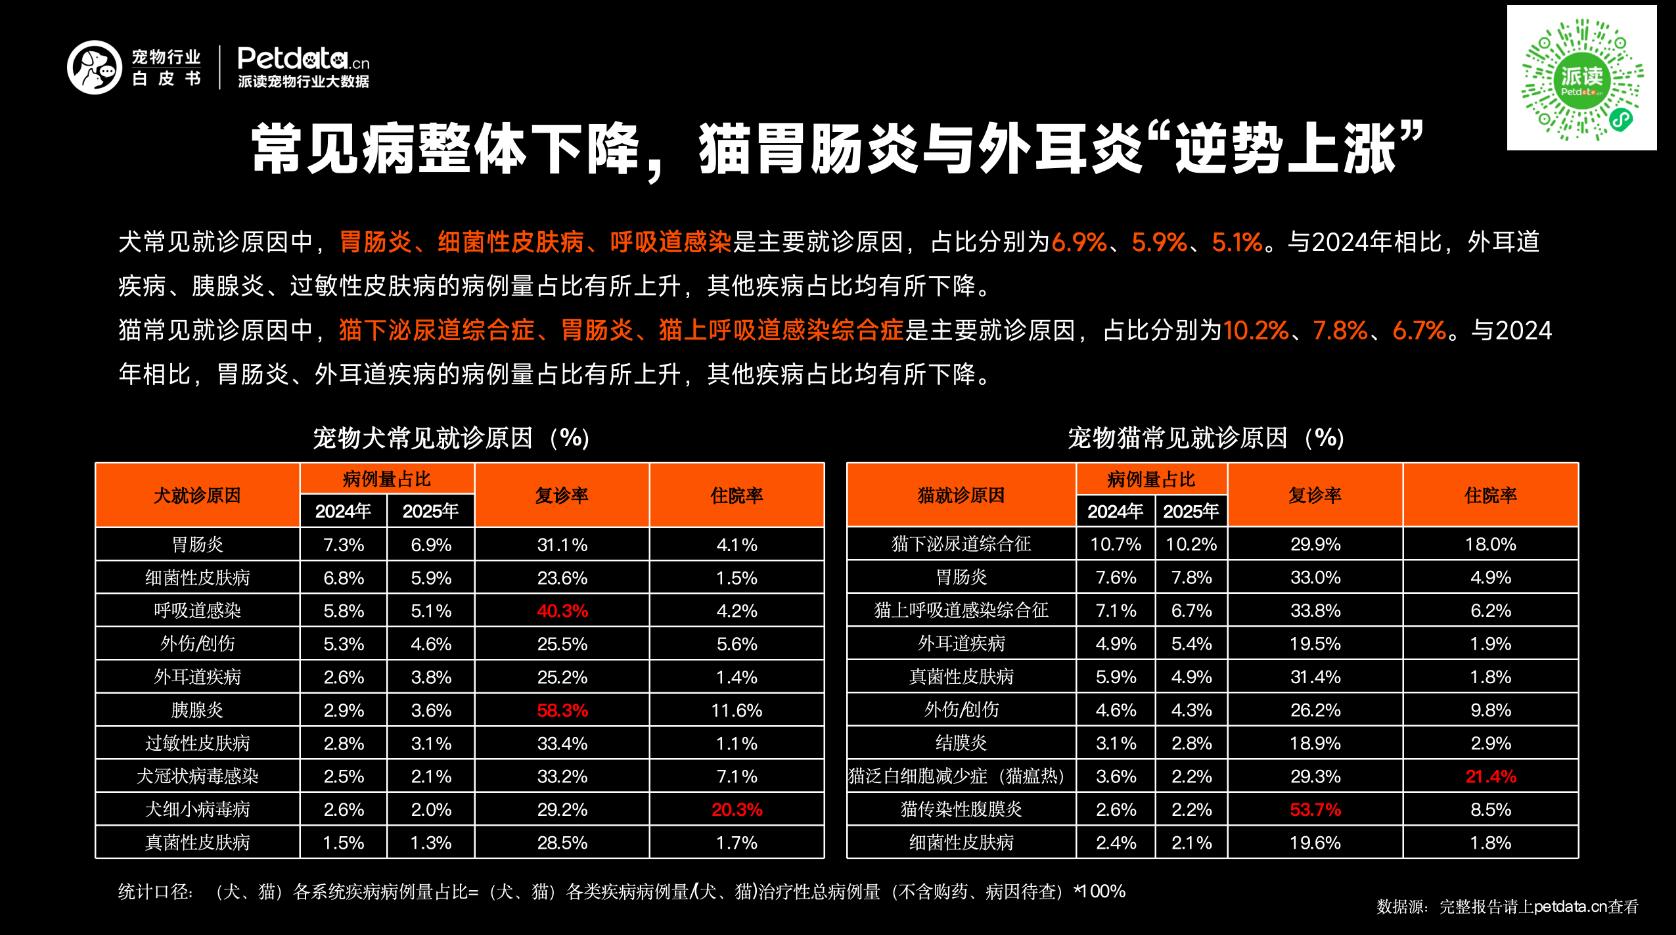
2. Overall Common Diseases Decline, but Feline Gastroenteritis and Otitis Externa Rise Against the Trend
Among the main reasons for dog hospital visits:gastroenteritis (6.9%), bacterial skin disease (5.9%), and respiratory infections (5.1%).Compared with 2024, the proportion of external ear diseases, pancreatitis, and allergic skin diseases increased, while other diseases decreased.
Among the main reasons for cat hospital visits:feline lower urinary tract disease (10.2%), gastroenteritis (7.8%), and feline upper respiratory infection syndrome (6.7%).Compared with 2024, the proportion of gastroenteritis and external ear diseases increased, while other diseases decreased.
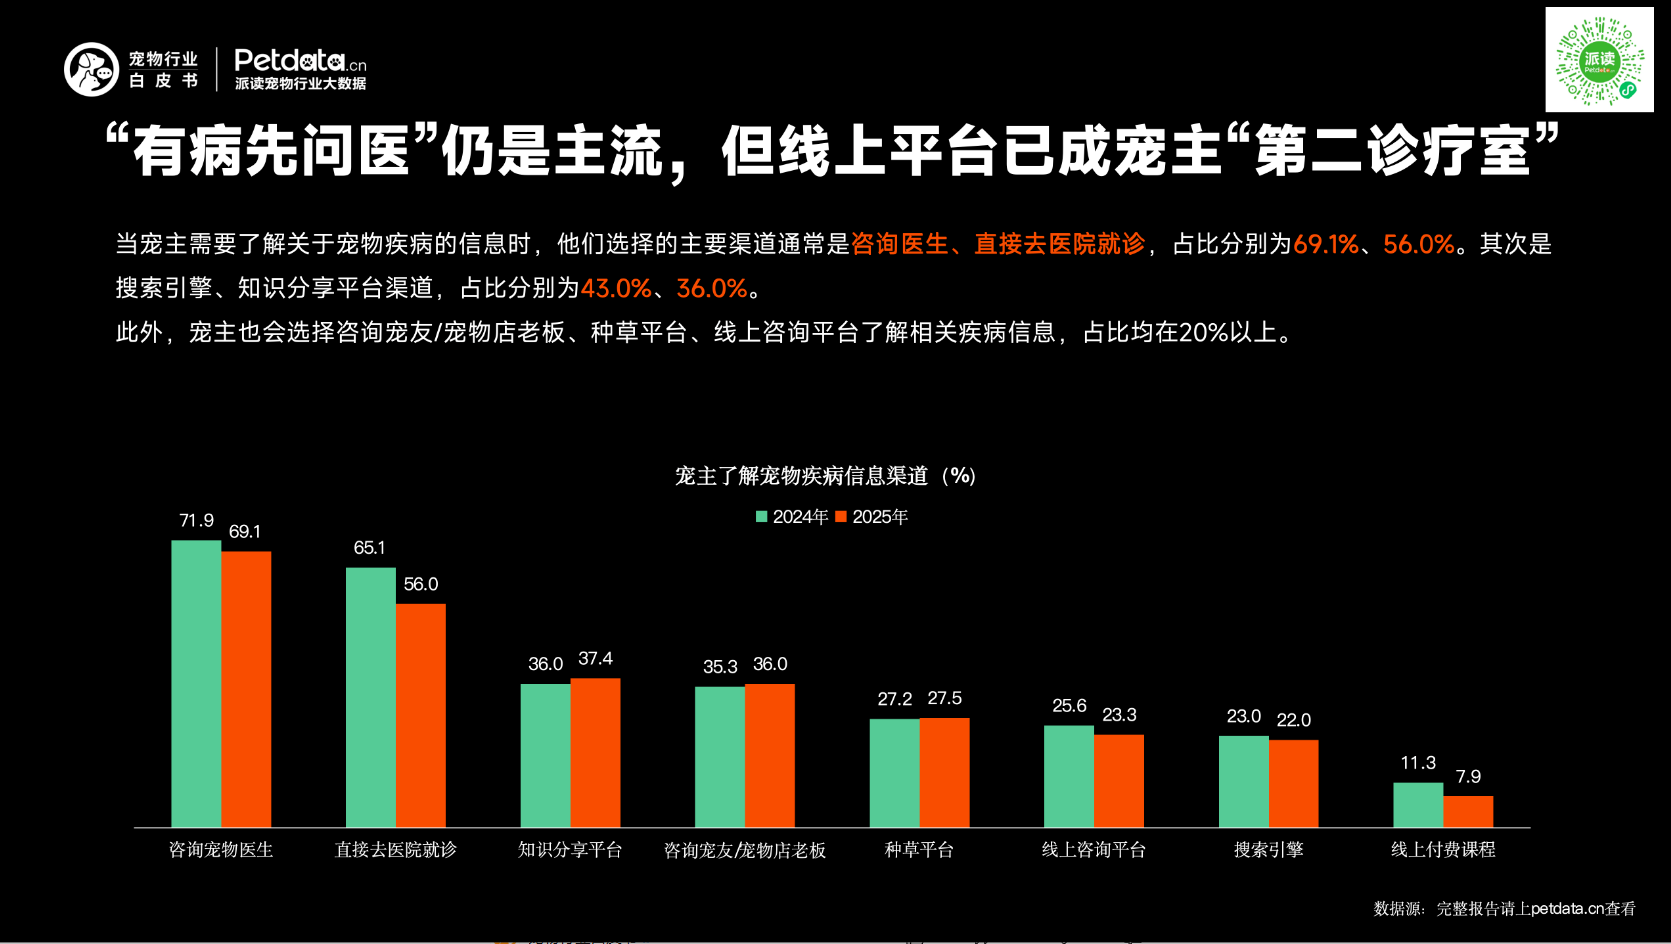
3. “Consult a Vet First” Remains Mainstream, but Online Platforms Have Become Pet Owners’ “Second Clinic”
When seeking information about pet diseases, the main channels are consulting a vet (69.1%) and visiting a hospital directly (56.0%).Next are search engines (43.0%) and knowledge-sharing platforms (36.0%).In addition, more than 20% of owners obtain information from fellow pet owners, pet shop owners, lifestyle recommendation platforms, and online consultation services.
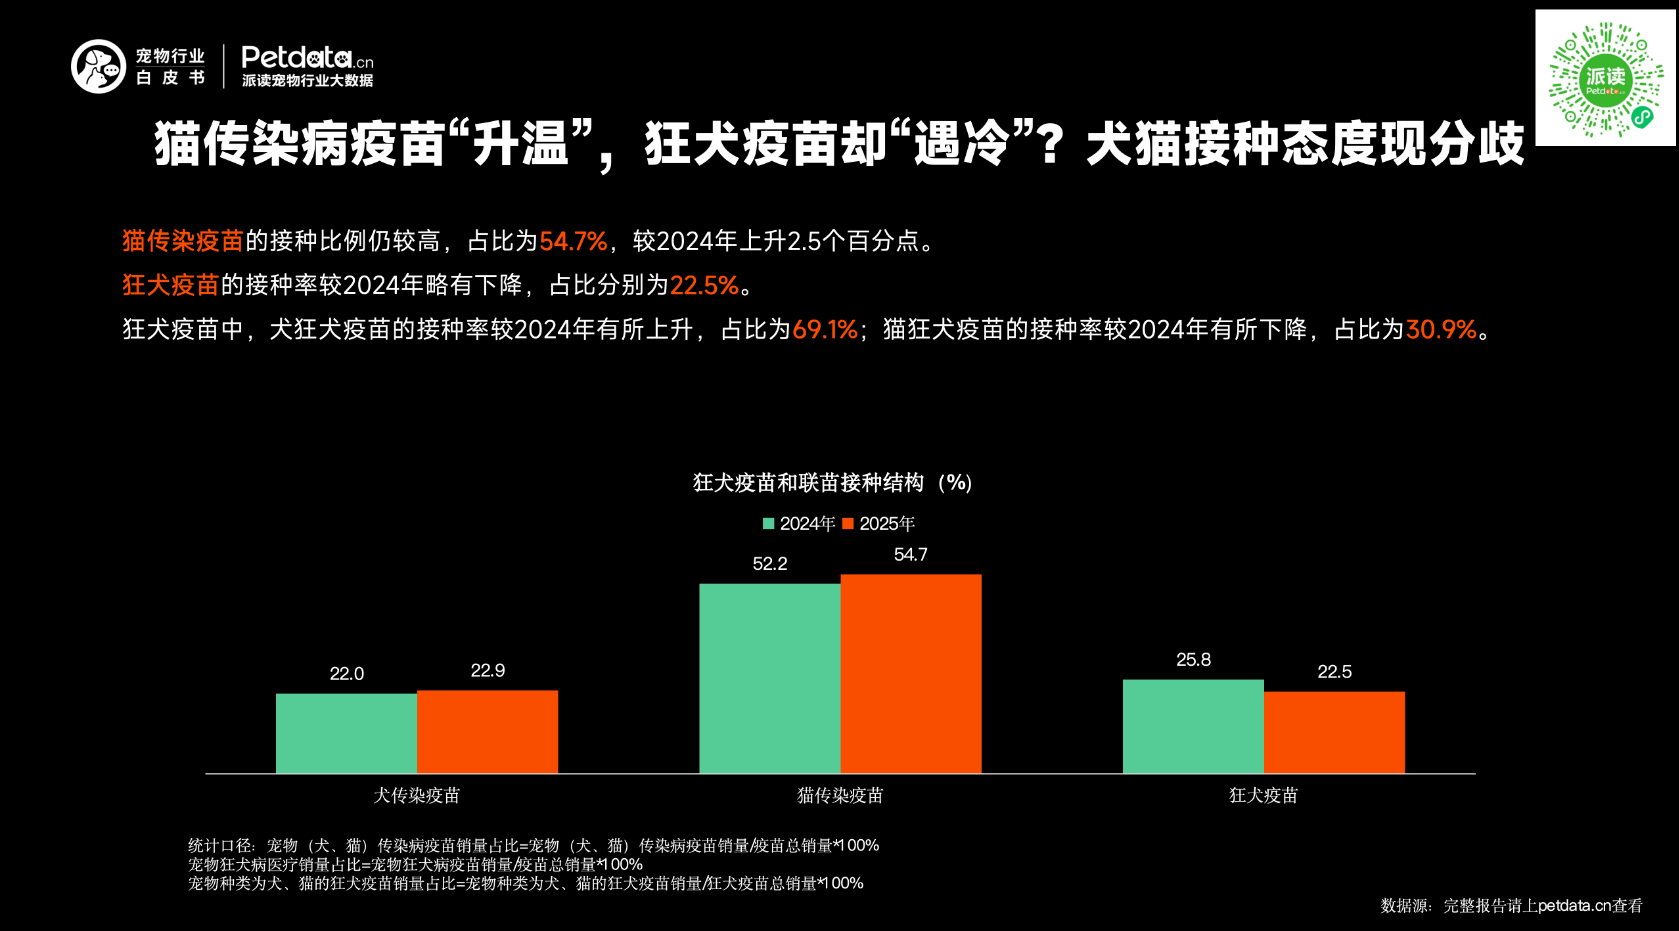
4. Feline Infectious Disease Vaccination Rises, While Rabies Vaccination Cools Down; Dogs and Cats Show Divergent Vaccination Attitudes
The vaccination rate for feline infectious diseases remained high at 54.7%, up 2.5 percentage points from 2024.The overall rabies vaccination rate slightly decreased to 22.5%.Among them:
· Dog rabies vaccination rate increased to 69.1%;
· Cat rabies vaccination rate decreased to 30.9%.
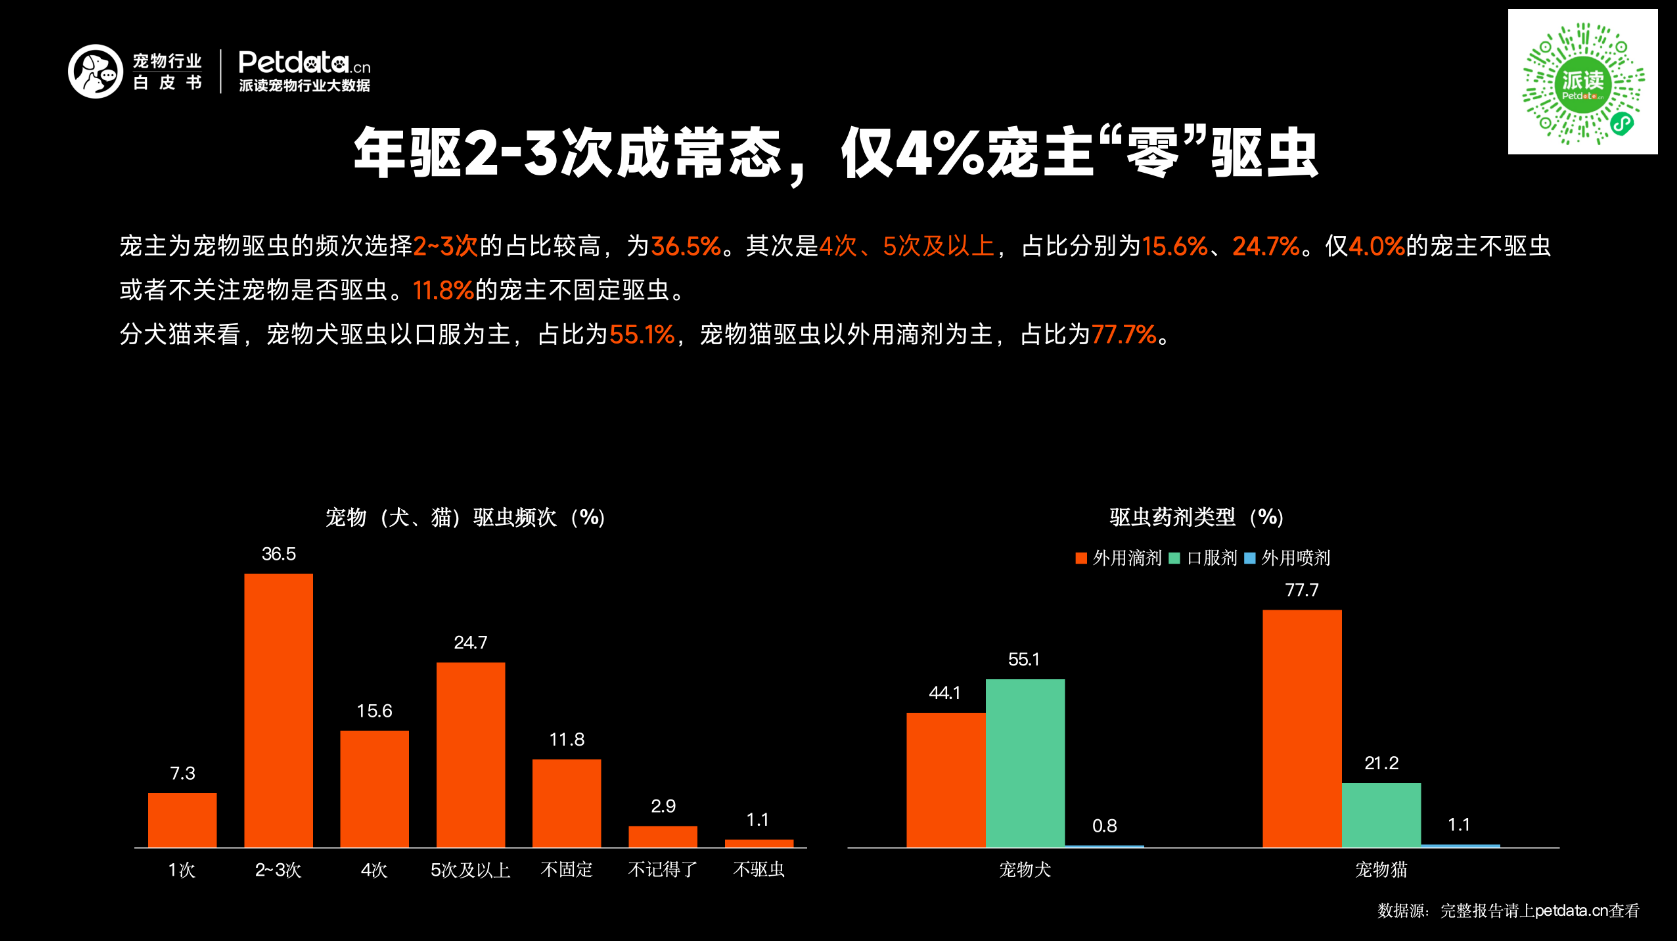
5. 2–3 Dewormings Per Year Become the Norm; Only 4% of Owners Do No Deworming
36.5% of owners deworm their pets 2–3 times a year,followed by 4 times (15.6%) and 5 or more times (24.7%).Only 4.0% of owners do not deworm or pay no attention to deworming,and 11.8% deworm irregularly.
By pet type:
· Dogs are mainly given oral dewormers (55.1%);
· Cats mainly receive topical spot-on dewormers (77.7%).
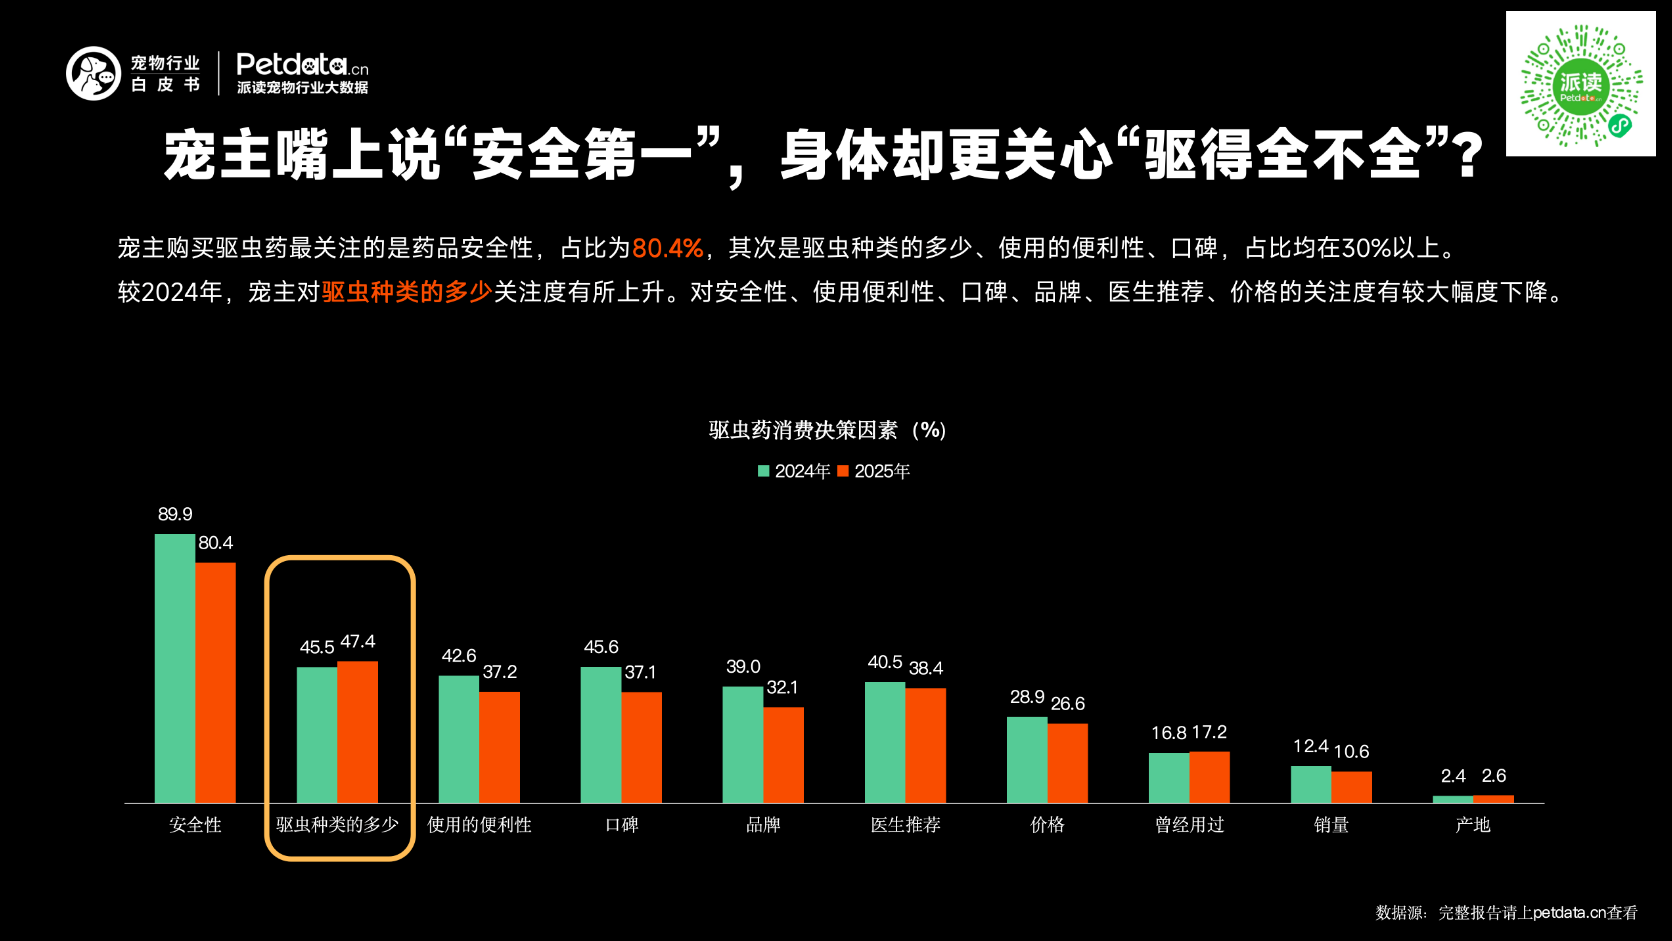
6. Owners Say “Safety First” but Care More About “Full Parasite Coverage”
The top concern when buying dewormers is product safety (80.4%).Next are parasite coverage range, ease of use, and reputation — all above 30%.
Compared with 2024:
· Attention to parasite coverage increased;
· Attention to safety, ease of use, reputation, brand, vet recommendation, and price decreased significantly.
Pet Services: Demand Diversifies, Decisions More Rational
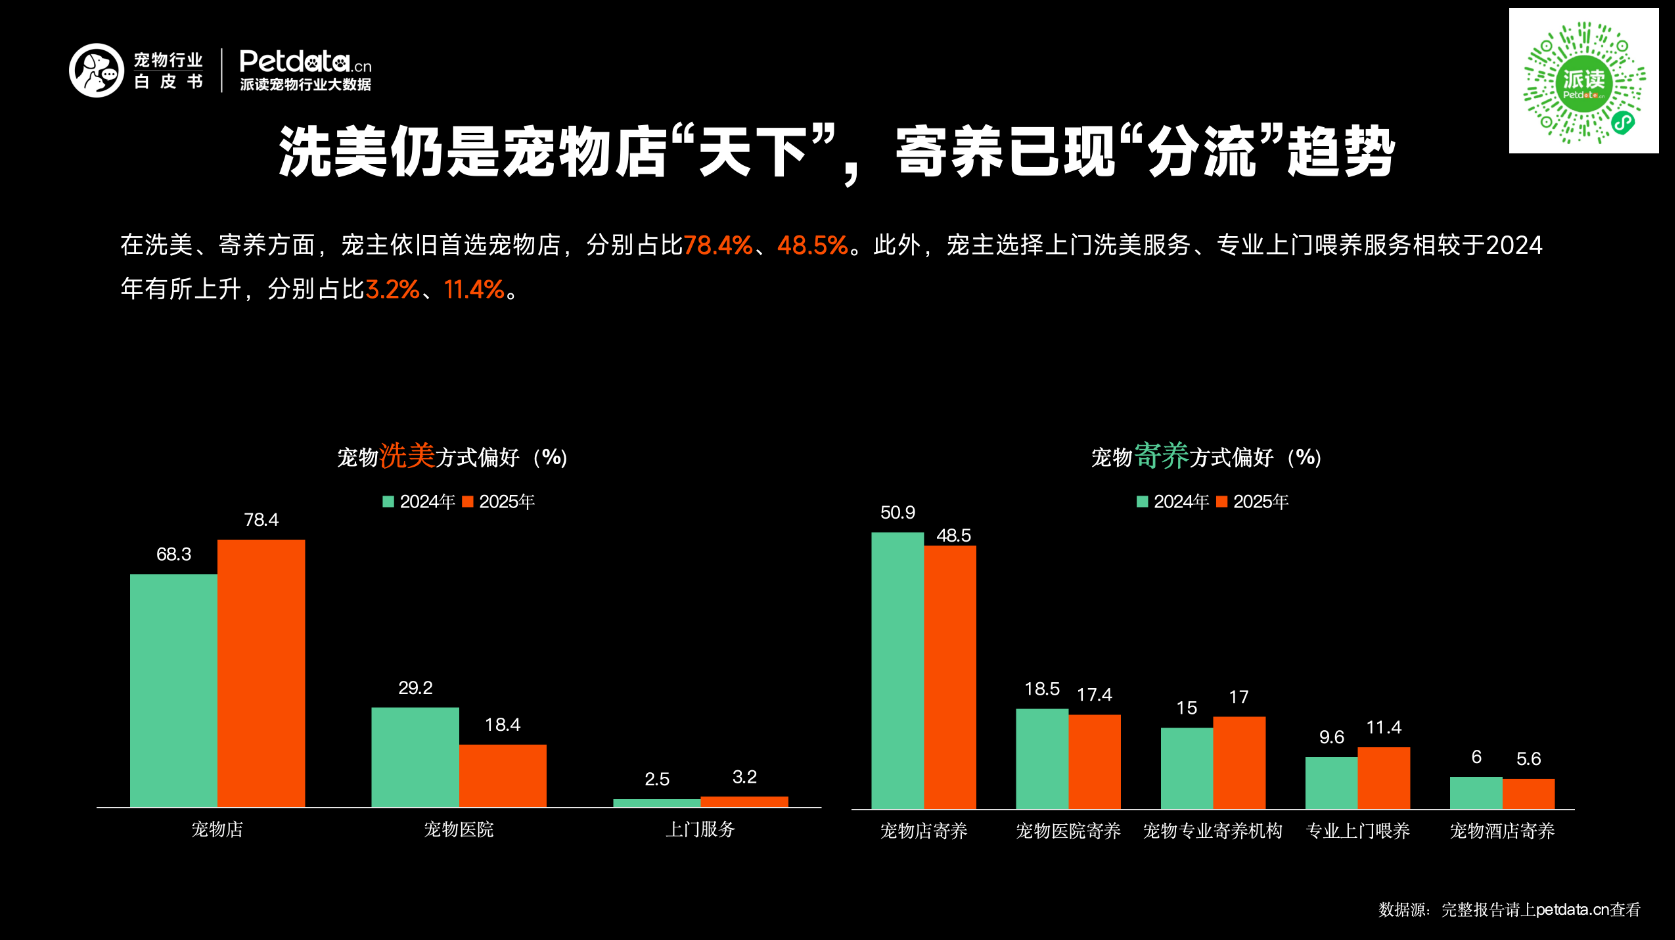
1. Grooming Still Dominated by Pet Shops
Boarding Shows Diversification TrendFor pet grooming and boarding services, pet owners still prefer pet shops as their first choice, accounting for 78.4% and 48.5% respectively.In addition, the proportion of pet owners choosing in-home grooming and professional in-home feeding services increased compared with 2024, reaching 3.2% and 11.4% respectively.
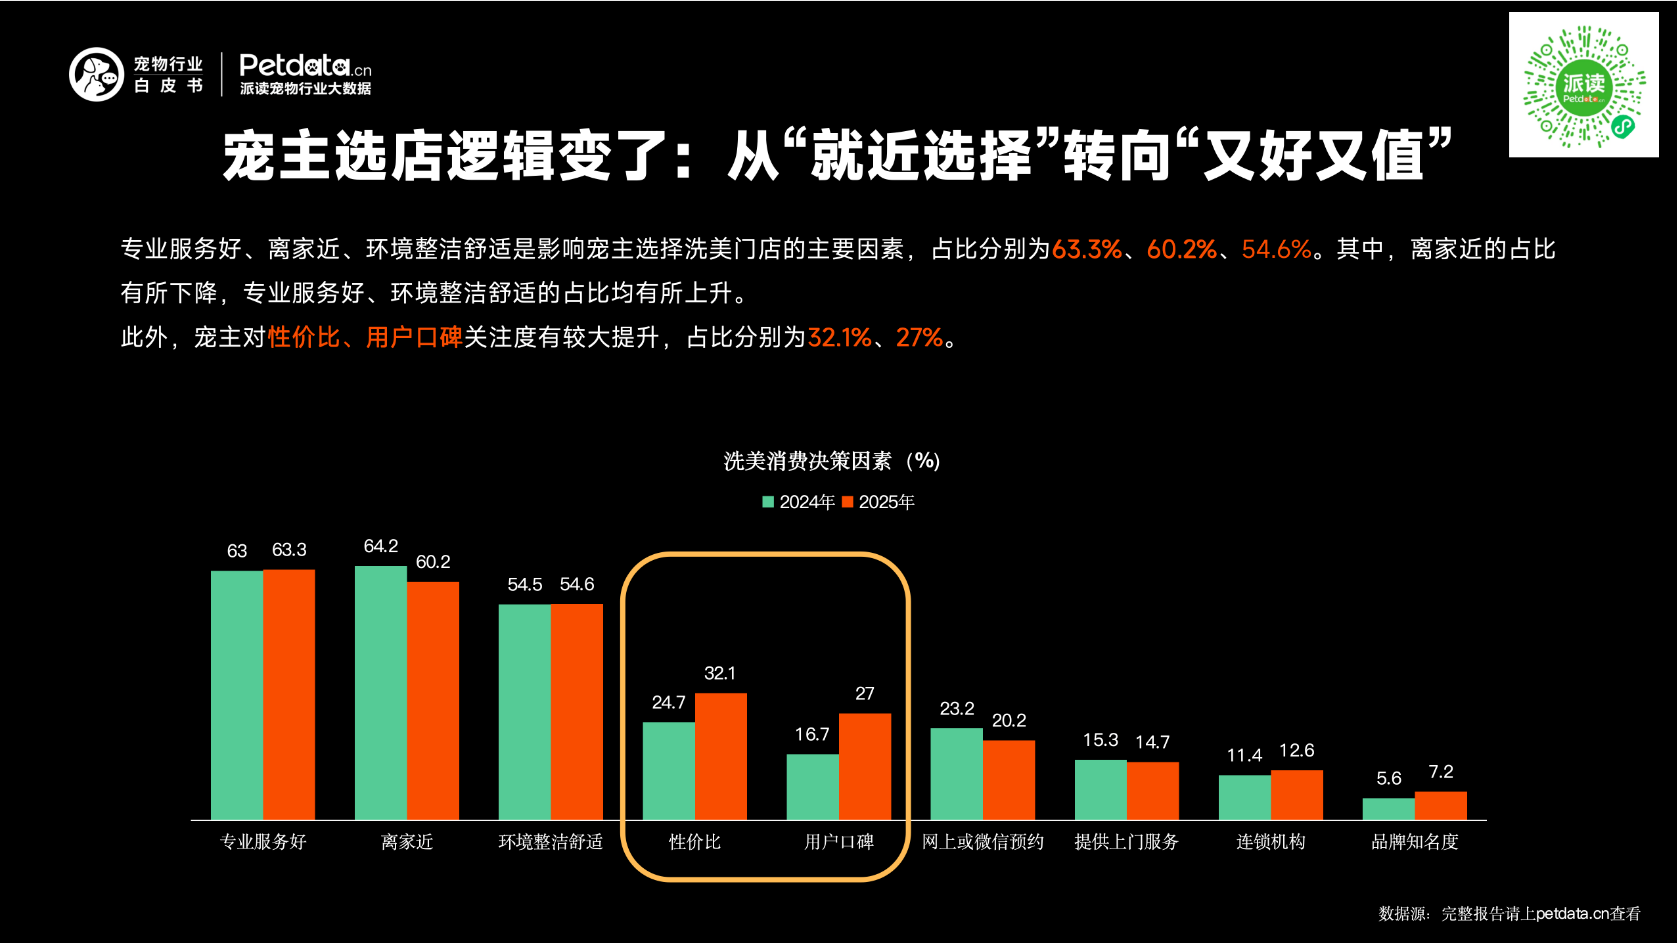
2. Pet Owners’ Shop Selection Logic Shifts: From “Closest” to “Best and Most Valuable”
Professional service quality, proximity to home, and clean and comfortable environment are the main factors influencing pet owners’ choice of grooming stores, accounting for 63.3%, 60.2%, and 54.6% respectively.Among them, the share of “proximity to home” decreased, while the shares of “professional service quality” and “clean and comfortable environment” both increased.Meanwhile, pet owners’ attention to cost performance and user reputation rose significantly, to 32.1% and 27% respectively.
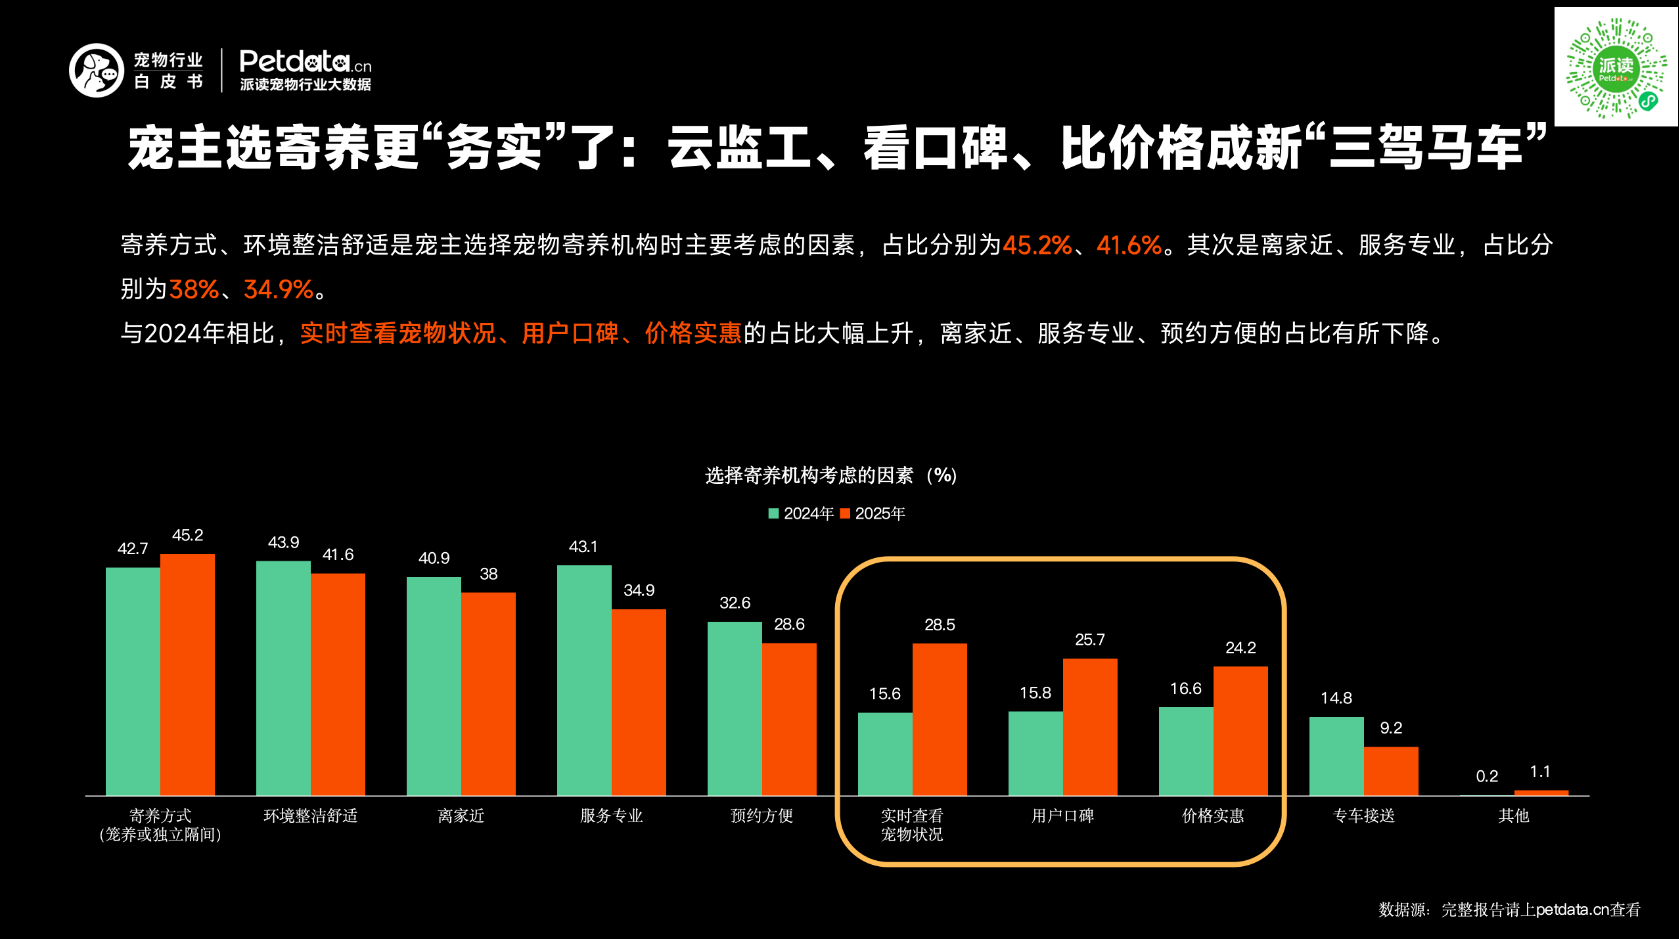
3. Pet Owners Become More Practical in Choosing Boarding:Real-time Monitoring, Reputation and Price Become the New “Three Pillars”
Boarding method and clean, comfortable environment are the primary considerations for pet owners when choosing pet boarding facilities, accounting for 45.2% and 41.6% respectively, followed by proximity to home (38%) and professional service (34.9%).Compared with 2024, the proportions of real-time pet monitoring, user reputation, and affordable price increased sharply, while the shares of proximity to home, professional service, and convenient booking decreased.
Exotic Pets: Niche Market Grows
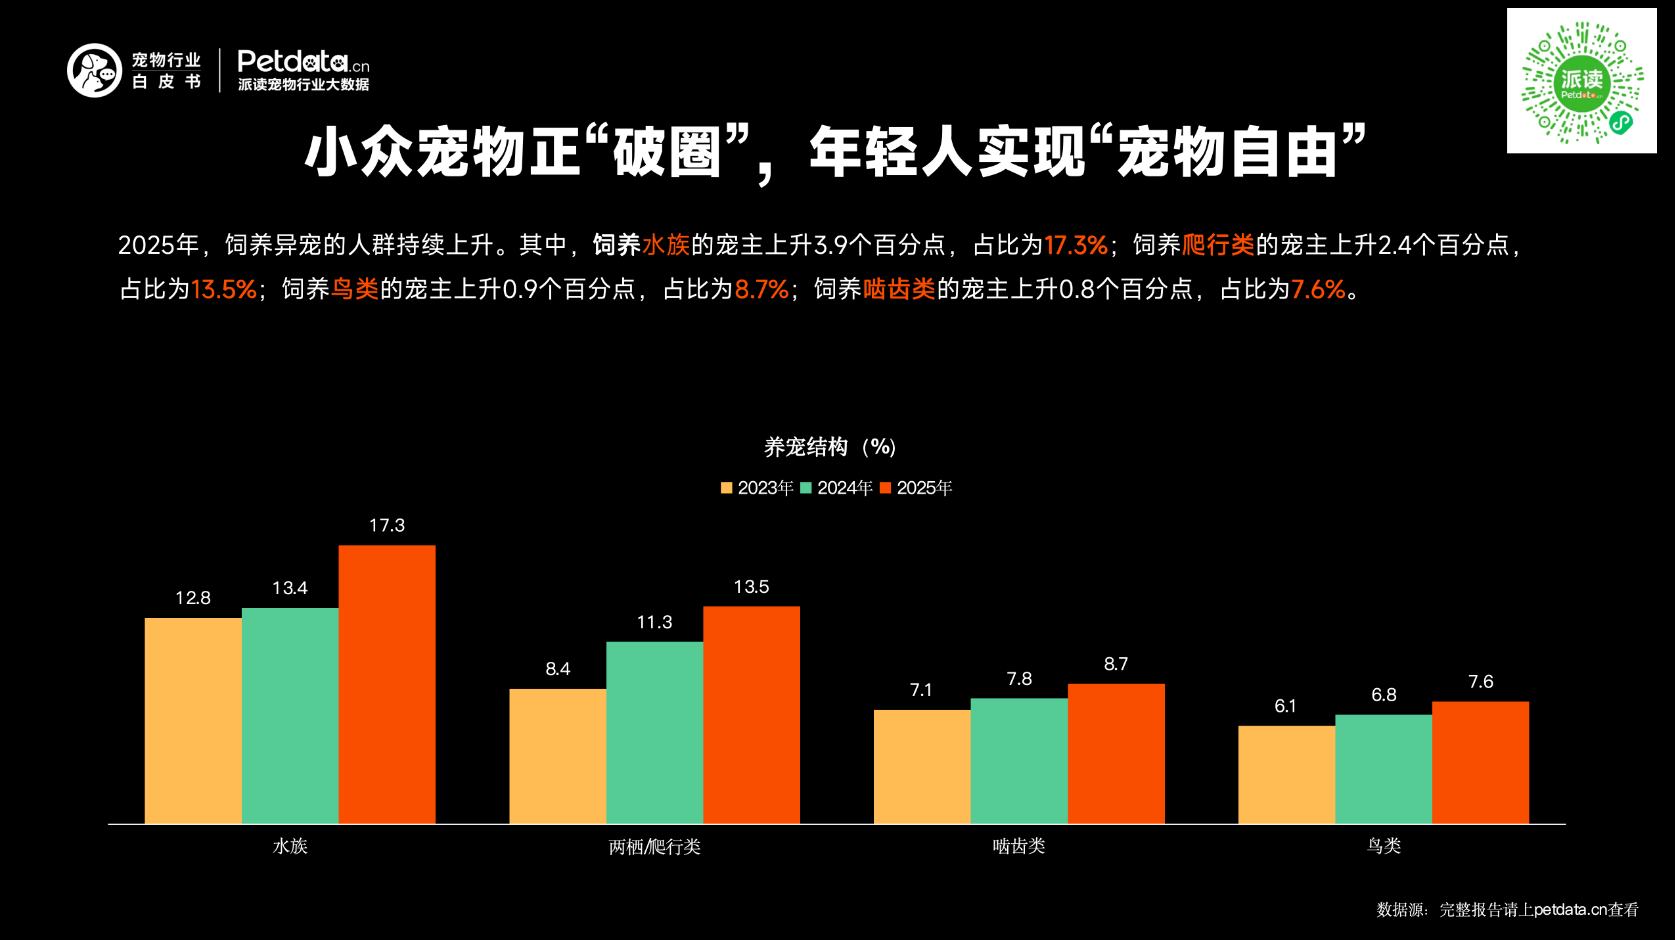
1. Niche Pets Go Mainstream: Young People Embrace "Pet Freedom"In 2025, the number of exotic pet owners continued to rise.
· Aquatic pet owners: increased by 3.9 percentage points, reaching 17.3%
· Reptile owners: increased by 2.4 percentage points, reaching 13.5%
· Bird owners: increased by 0.9 percentage points, reaching 8.7%
· Rodent owners: increased by 0.8 percentage points, reaching 7.6%
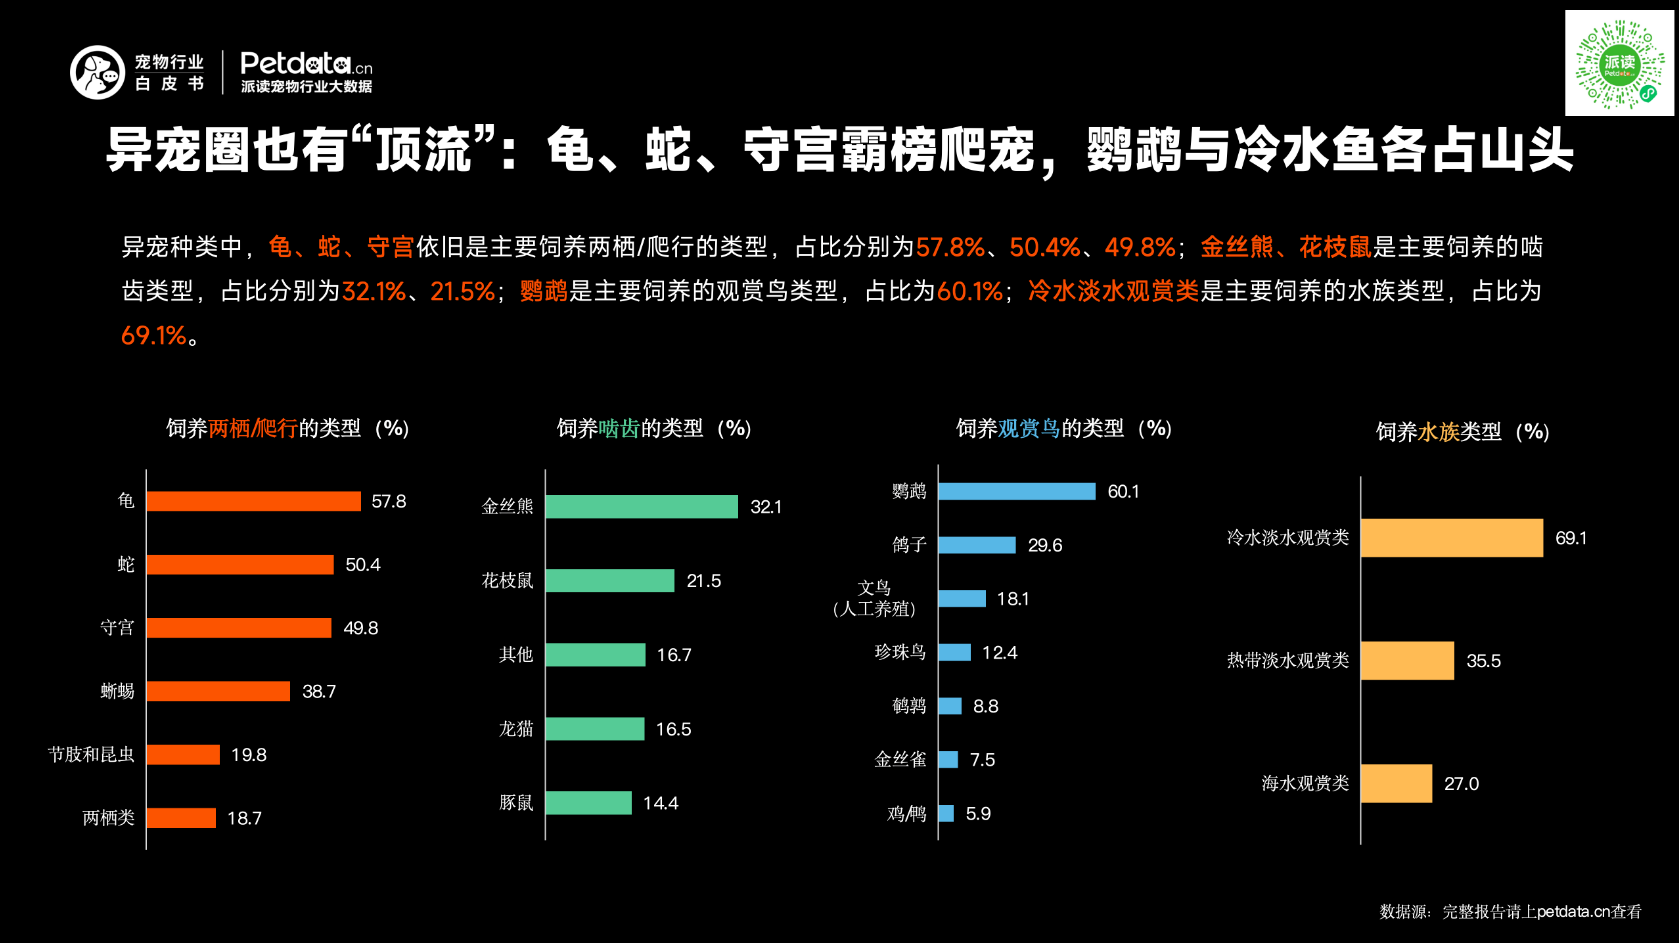
2. Exotic Pet Stars: Turtles, Snakes and Geckos Lead Reptiles; Parrots and Cold-Water Fish Dominate Their Categories
Among exotic pets:
· Turtles, snakes and geckos remain the most popular amphibians and reptiles, accounting for 57.8%, 50.4%, and 49.8% respectively.
· Golden hamsters and fancy rats are the most commonly kept rodents, at 32.1% and 21.5%.
· Parrots are the top ornamental birds, making up 60.1%.
· Cold-water freshwater ornamental fish are the most popular aquatic pets, at 69.1%.
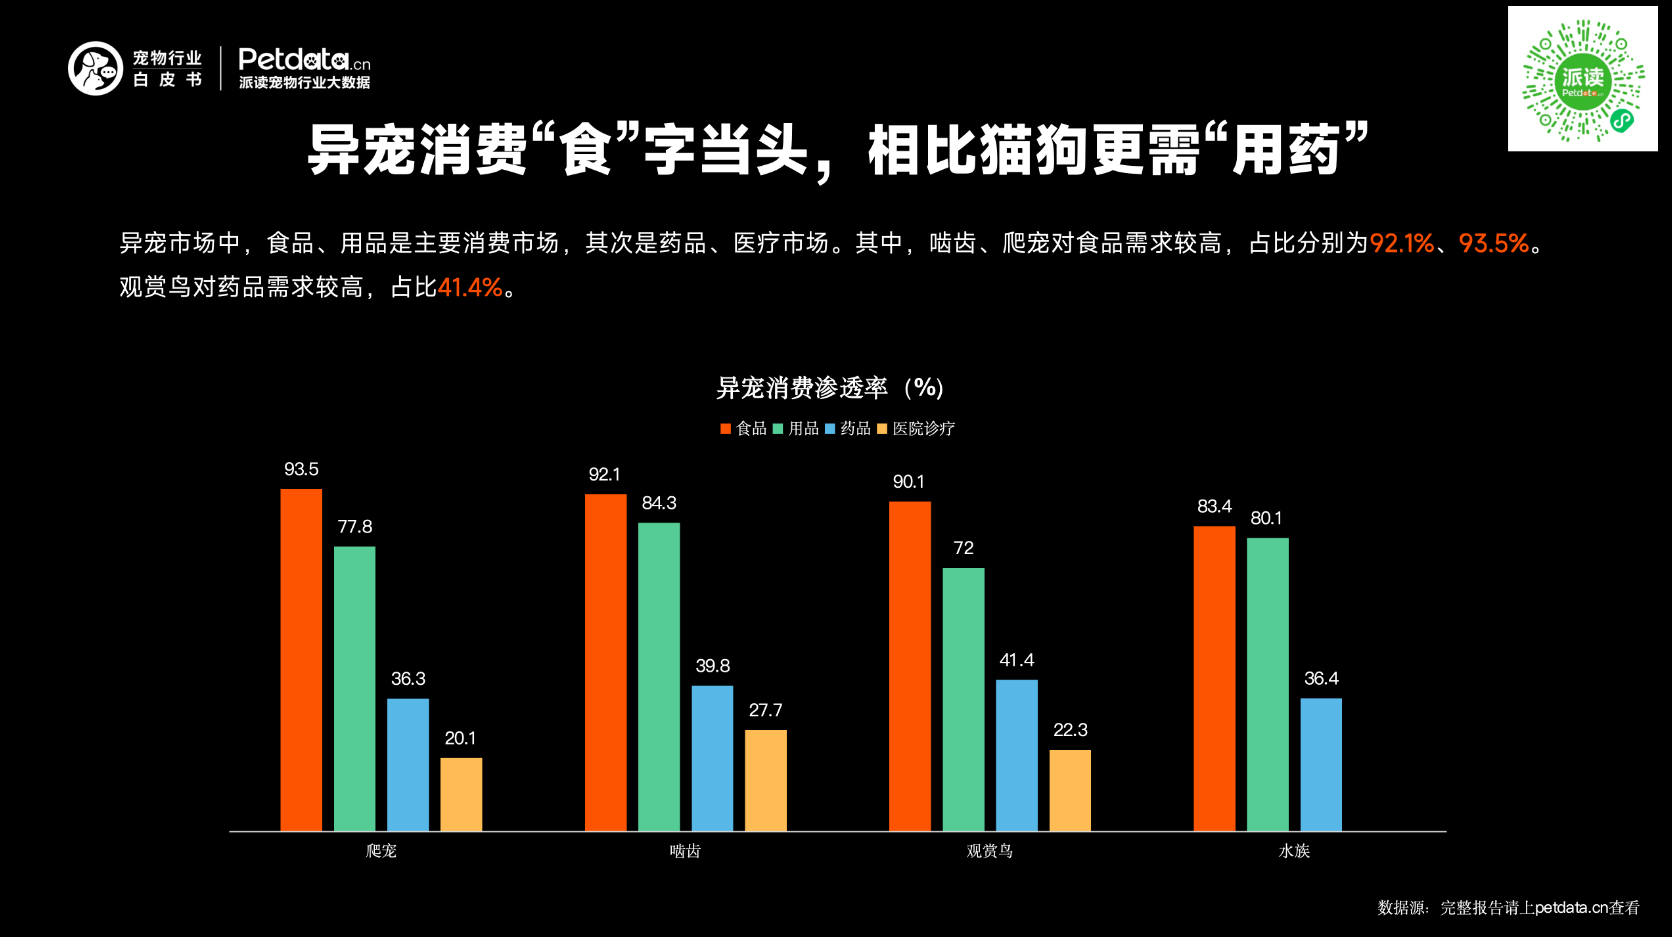
3. Exotic Pet Consumption: Food as the Top Priority, with Greater Medication Demand Compared to Dogs and Cats.
In the exotic pet market, food and supplies are the main consumption sectors, followed by medications and medical services.Among them, rodents and reptiles show a high demand for food, accounting for 92.1% and 93.5% respectively.Ornamental birds have a relatively high demand for medications, at 41.4%.
Emerging Trends
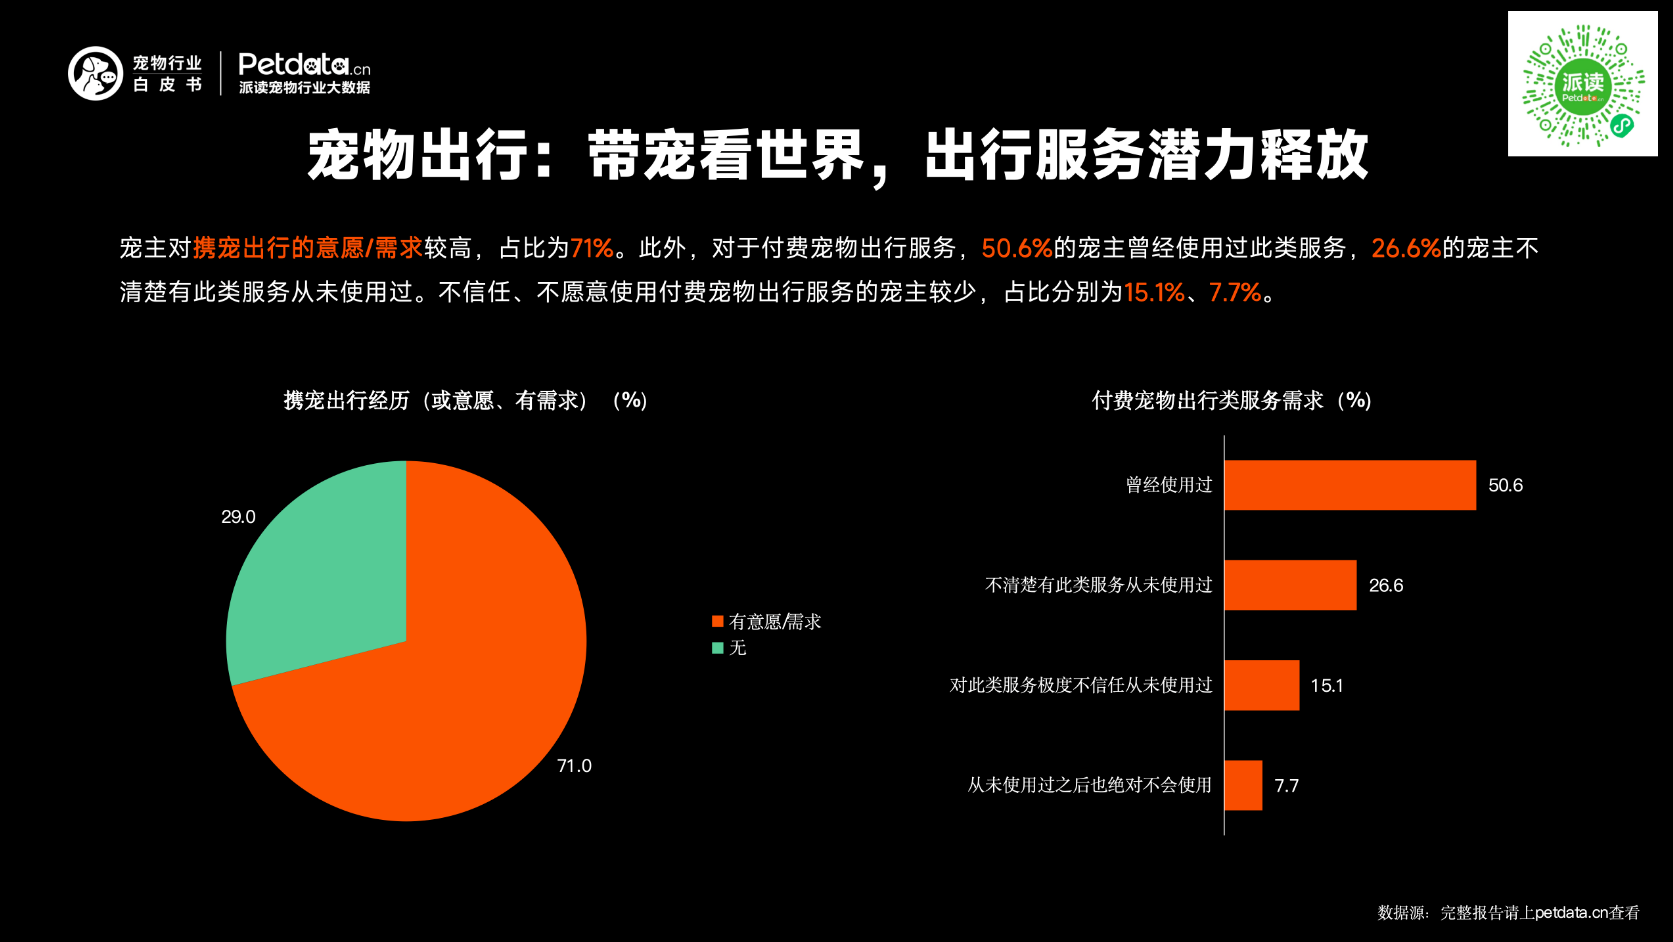
1. Pet Travel: Exploring the World with Pets, Unlocking the Potential of Travel Services
Pet owners show a strong willingness and demand for traveling with their pets, accounting for 71%.In addition, regarding paid pet travel services:
· 50.6% of pet owners have used such services.
· 26.6% have never used them because they were unaware of their existence.
Only a small share of owners do not trust or are unwilling to use paid pet travel services, at 15.1% and 7.7% respectively.
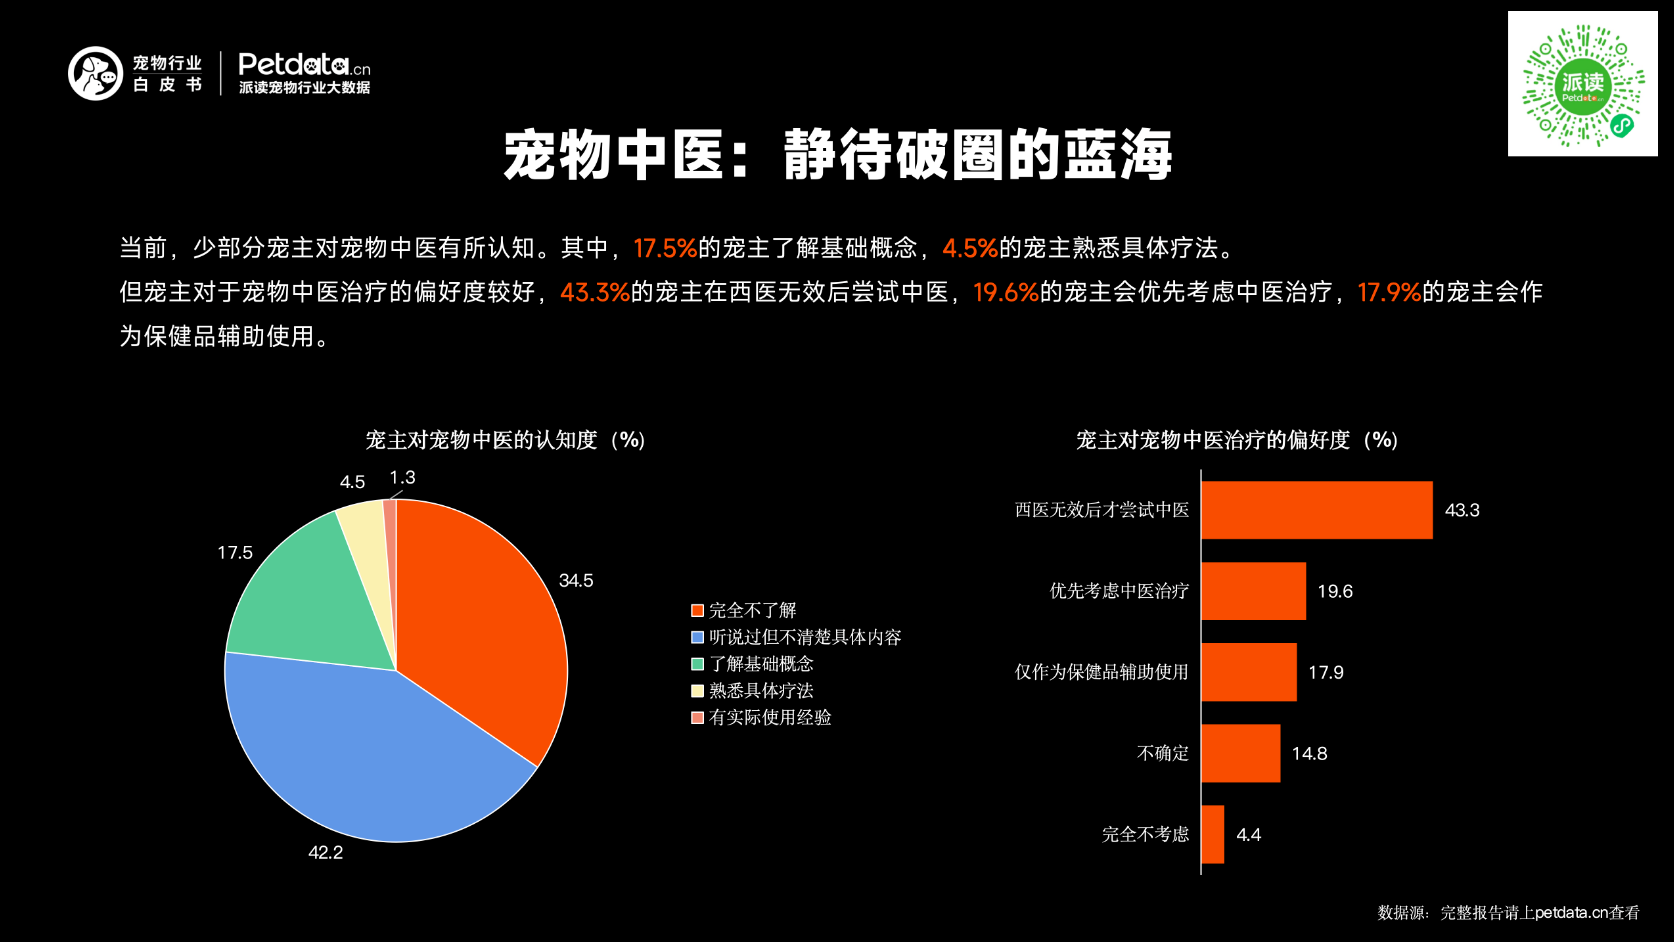
2. Pet Traditional Chinese Medicine: A Blue Ocean Waiting to Break Through
Currently, only a small number of pet owners have knowledge of pet Traditional Chinese Medicine (TCM). Among them, 17.5% of pet owners understand the basic concepts, and 4.5% are familiar with specific therapies.
However, pet owners show a strong preference for pet TCM treatment:
43.3% of pet owners would try TCM after Western medicine proves ineffective, 19.6% would give priority to TCM treatment, 17.9% would use it as a health supplement
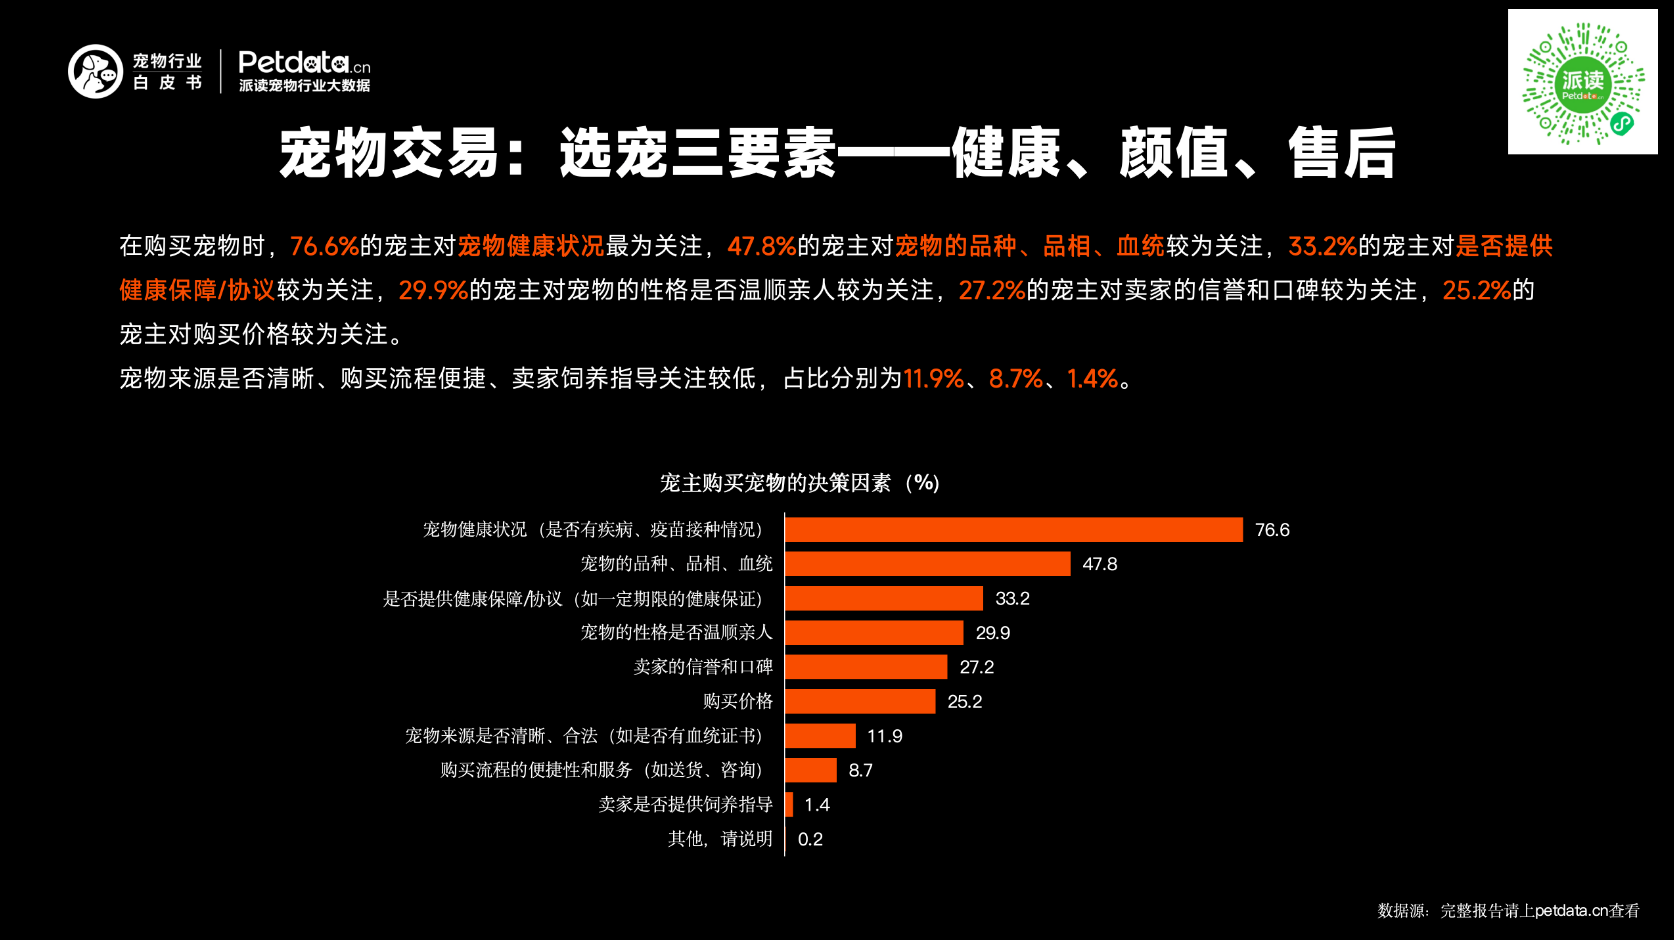
3. Pet Trading: Three Key Factors in Choosing a Pet – Health, Appearance, and After-Sales Service.
When purchasing a pet: 76.6% of pet owners are most concerned about the pet’s health status, 47.8% focus on the pet’s breed, appearance, and pedigree, 33.2% care about whether a health guarantee/agreement is provided, 29.9% pay attention to whether the pet has a gentle and friendly temperament, 27.2% consider the seller’s reputation and word of mouth, 25.2% are concerned about the purchase price.
Lower levels of attention are given to: Clear pet origin (11.9%). Convenient purchase process (8.7%). Seller’s feeding guidance (1.4%)
Copyright © 2008-2026 | China Great Wall International Exhibition Co., Ltd.